Natural gas looks doomed again. Poor old natty has spent the entire week declining from an already low level, and two things that happened during that drop suggest that it is far from over. At this point, a break of the psychologically important $2 level looks imminent and if that happens it will probably trigger even more selling as the last of the stubborn longs rush for the exit.
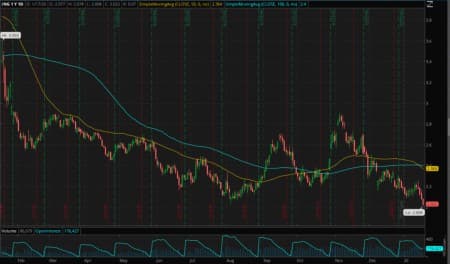
The first of those things happened on Tuesday when the long-term chart for natural gas futures (NG) exhibited a well-known, ominous-sounding pattern…a death cross.
It can be seen on the chart above, when the solid yellow line, which represents the 50-day moving average, crosses the blue line, representing the 100-day average. That is generally considered by traders and analysts to be a very bearish indicator.
The problem with anything like this that relies on momentum is that to some extent, when the signal appears it is really just a confirmation of something that has already occurred. Natty has been falling since it hit a peak of around 2.90 in early November, so a bearish signal can’t really be seen as new. However, the price action that followed the last, similar signal suggests that it shouldn’t be ignored.
In October, natural gas futures did the opposite…they showed a “golden cross”, when the short-term average crosses the long in an upward direction. I pointed that out in an article in these pages at the time, and sure enough, after closing that week at around…
Natural gas looks doomed again. Poor old natty has spent the entire week declining from an already low level, and two things that happened during that drop suggest that it is far from over. At this point, a break of the psychologically important $2 level looks imminent and if that happens it will probably trigger even more selling as the last of the stubborn longs rush for the exit.

The first of those things happened on Tuesday when the long-term chart for natural gas futures (NG) exhibited a well-known, ominous-sounding pattern…a death cross.
It can be seen on the chart above, when the solid yellow line, which represents the 50-day moving average, crosses the blue line, representing the 100-day average. That is generally considered by traders and analysts to be a very bearish indicator.
The problem with anything like this that relies on momentum is that to some extent, when the signal appears it is really just a confirmation of something that has already occurred. Natty has been falling since it hit a peak of around 2.90 in early November, so a bearish signal can’t really be seen as new. However, the price action that followed the last, similar signal suggests that it shouldn’t be ignored.
In October, natural gas futures did the opposite…they showed a “golden cross”, when the short-term average crosses the long in an upward direction. I pointed that out in an article in these pages at the time, and sure enough, after closing that week at around 2.35, NG hit that 2.90 high three weeks later.
I have said many times before and no doubt will again that technical signals and analysis can only take you so far and will always be outweighed by fundamental considerations in commodity trading. However, a recent history of a correct indication makes it more likely that traders this one at face value and that it will prompt enough selling to make it a self-fulfilling prophecy.
That view is also reinforced by the other indication this week, which does concern the fundamentals of supply and demand.
On Wednesday, when “phase one” of the trade deal between the U.S. and China was finally signed at the White House, it contained a clause that mandated the Chines to buy liquefied natural gas (LNG) from the U.S. as part of the $52.4 billion of energy purchases over the next two years.
It was known beforehand that there would be some such clause in the deal but even so, one would expect the signing of the agreement to be a positive for U.S. natural gas. On Wednesday though, as the size of the commitment became clear, NG barely paused in its downward plunge. When traders ignore significant news, it generally means that panic, not logic, is driving the market, and that is a very powerful force.
At some point, a combination of that logic and the impact of price on supply will have a positive effect. When prices fall, production gets cut as fewer operations remain profitable. Eventually, that leads to shortages which push the price up. That, however, looks to be some way away.
Natural gas pricing is distorted by its role as a “byproduct” of oil production in some cases, and also by subsidies prompted by the prevailing view that it is a clean, or at least cleaner, energy source. Those things delay the impact of price on output. The laws of supply and demand will overcome the distortion eventually, but it will take a while.
So, while the bounce back in natty will probably be a great opportunity to profit in the future, that future could be some way off. In the short-term, a drop to a level significantly below $2 looks more likely than not.


