There are cracks beginning to appear in U.S. shale’s relentless growth story, and the indicators are all around us. We will run through some of the most glaring examples in a moment.
First, I want to briefly opine on the impact of this trend for the world oil market. It is priced currently for what I would call perfection. Iran and the U.S. are still only calling each other names. China and the U.S. are making jaw-jaw once again on the topic of a trade deal. As a result, oil has sagged down about $5.00 a barrel over the first couple of days this week. All in the face of large crude storage builds in the U.S. over the past month.
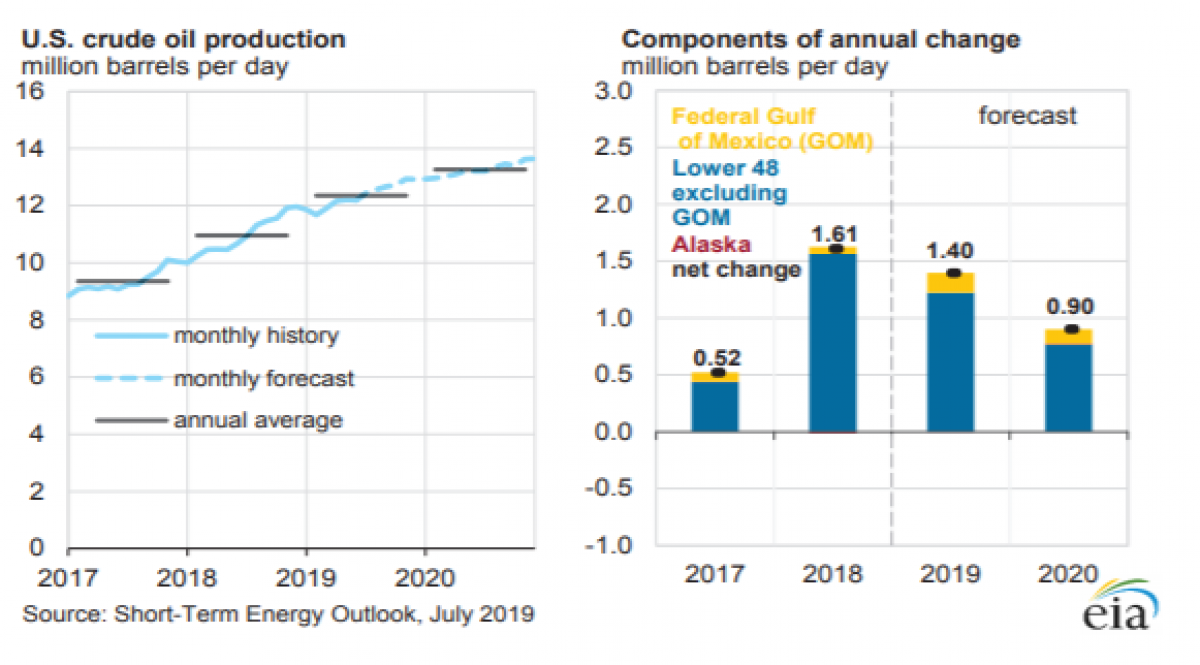
Meanwhile, the world market seems well supplied: everyone has all the oil they need and expects to maintain that situation for the foreseeable future. Everything is rosy. The linchpin in that warm glow of market satiety is the 15-20% YoY growth of U.S. production over the last decade. Every prognosticator on the planet, now refers to the U.S. as being the swing producer, able to fill all the pots and pans globally. The EIA is the worst of the lot. Their robust growth projections are contained in the graphic below.
STEO
But suppose the growth rate in U.S. shale can’t rise forever? What if shale production actually dropped? Now, let me be clear, no one, absolutely no one is forecasting that eventuality.
And, that’s what worries me. Think I’m a worry wart? Let’s take a trip back to September of 2014 when a pundit,…
There are cracks beginning to appear in U.S. shale’s relentless growth story, and the indicators are all around us. We will run through some of the most glaring examples in a moment.
First, I want to briefly opine on the impact of this trend for the world oil market. It is priced currently for what I would call perfection. Iran and the U.S. are still only calling each other names. China and the U.S. are making jaw-jaw once again on the topic of a trade deal. As a result, oil has sagged down about $5.00 a barrel over the first couple of days this week. All in the face of large crude storage builds in the U.S. over the past month.
Meanwhile, the world market seems well supplied: everyone has all the oil they need and expects to maintain that situation for the foreseeable future. Everything is rosy. The linchpin in that warm glow of market satiety is the 15-20% YoY growth of U.S. production over the last decade. Every prognosticator on the planet, now refers to the U.S. as being the swing producer, able to fill all the pots and pans globally. The EIA is the worst of the lot. Their robust growth projections are contained in the graphic below.

STEO
But suppose the growth rate in U.S. shale can’t rise forever? What if shale production actually dropped? Now, let me be clear, no one, absolutely no one is forecasting that eventuality.
And, that’s what worries me. Think I’m a worry wart? Let’s take a trip back to September of 2014 when a pundit, by the name of Andrew John Hall forecast $150 oil in Business Insider, a respected publication. Andrew’s predictions were historical so reliable as regards oil prices, that he was referred to in the market as “God.” You can’t get much more authoritive than that, and reliability on a deity-like level was probably among the attributes that had led him to become CEO of Phibro, a commodities trading house.
Hall based his prediction on the demise of U.S. shale, feeling that the Saudis would be successful in bringing down the juggernaut that had begun to gore their ox, figuratively speaking. In his scenario oil rose from scarcity as a result of shale cratering. He believed this so passionately, that he opined in a newsletter to clients thusly, as he bought oil futures contracts for their accounts.
"When you believe something, facts become inconvenient obstacles."
(I’ll bet he wishes he could cram that little gem back in the bottle! Note to self: never use the words “facts” and “inconvenient obstacles” in the same sentence!)
We all know what happened to oil over the next couple of years. American shale frackers proceeded to pull a Hat-Trick. They recapitalized, cut their breakeven costs by 50%, and upped production per foot of interval. Oil production from the U.S. resumed its upward march, and the Saudis threw in the market share towel by mid-2015, and closed the choke a hair on their side of the planet, with hopes of improving prices. Supply and demand then fell into a pseudo-balance over the next year, and by 2017 we were off on another nice ramp in the oil price.
Someone else is now CEO of Phibro. I have no inkling if that fact relates to this monster missed market call. Hall may have gone back to his main job of running the universe.
But, suppose Hall was right? Way early, but right none-the-less? That is the scenario we find ourselves discussing, five years hence. What if shale has peaked, and is about to begin a slow decline? I’ll leave that thought for you to consider and provide some commentary later in this article. For now, let’s take a look at some of the indicators I’ve mentioned above.
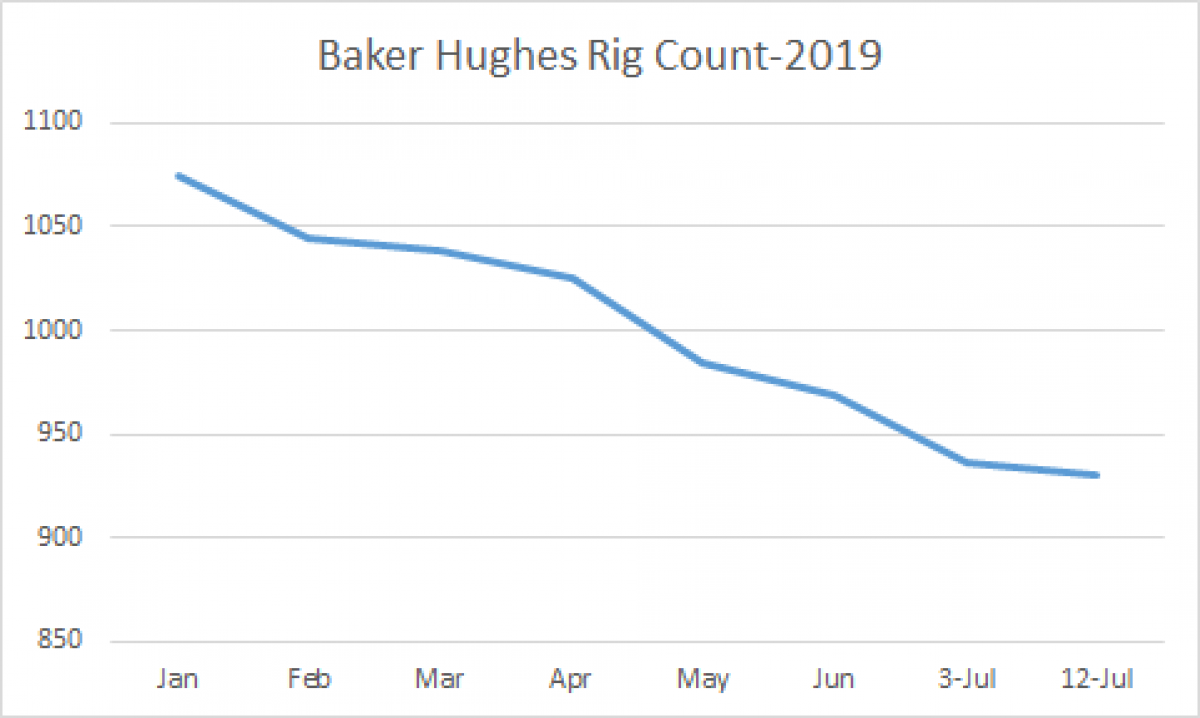
Decline in the Baker Hughes Rig Count-U.S. Land, 2019
The rig count is dropping as shown in the first graphic below, and most alarmingly in the Permian, which has been the primary engine of growth as seen in the second graphic.
Baker Hughes, Chart by author
Baker Hughes U.S. Land, by Major Basin, 2019
Baker Hughes, Chart by author-Note-Permian count is on right axis!
As discussed in my recent piece on the impact crude quality may play on oil supplies, American production is starting to flatten in the 12 mm BOD range. We may even see production dip down as certain economic realities begin to grip the here-to-fore free- wheeling shale drilling business. Realities that include, but are not limited to;
- Well spacing and inter-well harmonics (frac-hits)
- Rock quality and growing scarcity of Tier 1 acreage
- Capital discipline edges out "growth at any cost"
- Takeaway capacity
EIA, Chart by author
As we move from Q-4, 2018 through Q-2, 2019 we can see there is a definite flattening of the curve. There is beginning to be a bit of a schism in the EIA's STEO domestic crude production projections and reality. Early signs, but there none the less. This report projects U.S daily production approaching 13.8 mm BOED by the end of 2020, an increase of about 1.6 mm BOED from present levels. Even if achieved, that would represent a growth rate of 11.5%, down from 2018's pace of 17% production growth.
Worth noting. Baked into the EIA's forecast is growth from the GoM of 200K BOED in 2020. I have my doubts about this as well given the under-capitalization of this space for the last few years.
So wrapping up this section, I am going on record as saying that even if only the growth rate for shale declines, it is going to leave the world market under-supplied, by 500K-1 mm BOD. If shale production actually declines in real numbers, Anthony Hall’s rosy forecast of $150.00 oil will become a reality in a very short period of time.
Will offshore deepwater bail us out?
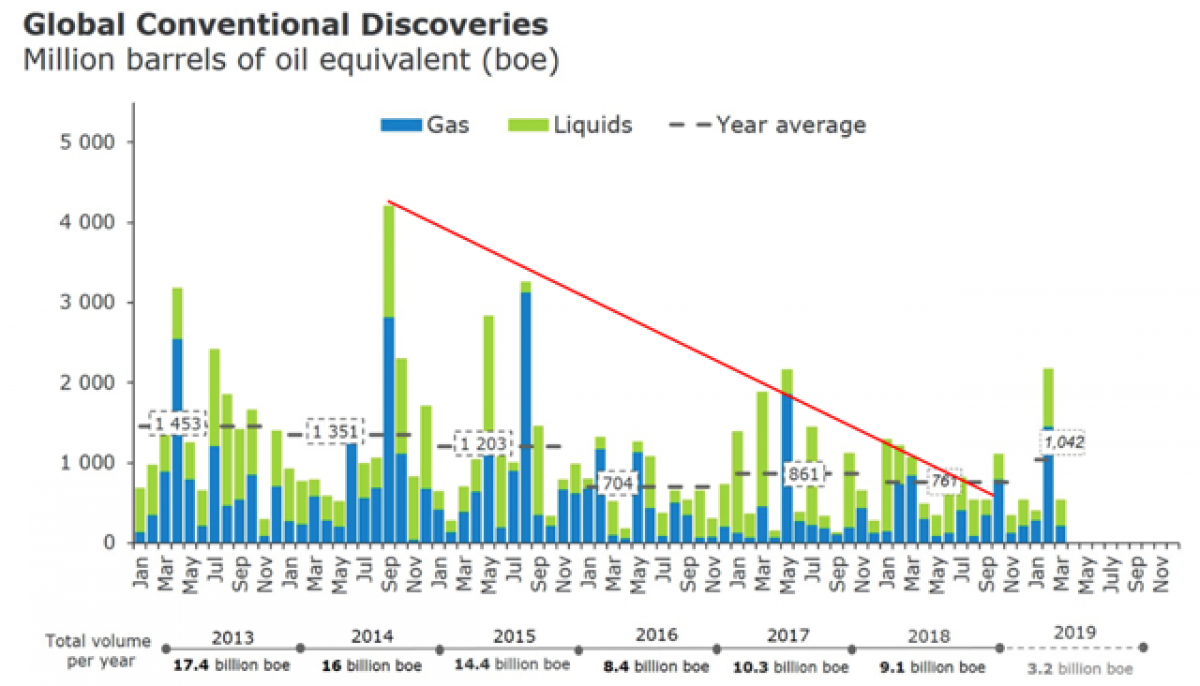
The other big compartment from which the world take its oil lies in the deepwater marine environment. This area has been famously under-capitalized in recent years, as has been well documented.
Source: Rystad
You can see from the Rystad graphic above that as capex declined, the discovery rate of conventional oil dropped from 16 bn BOE in 2014 to 9.1 bn in 2018. With only 3.2 bn bbl discoveries announced so far in 2019, the success rate will have to run pretty hard to reach 7.0 bn for the year. This would equate to a 45% decline over 5-years. The math isn't working very well here.
I am not ready to make a call as to the likelihood of the EIA's projections being wrong (horribly so), or not. But, I am ready to say that the trends I am seeing aren't supportive of that outcome.
Can OPEC come to the rescue?
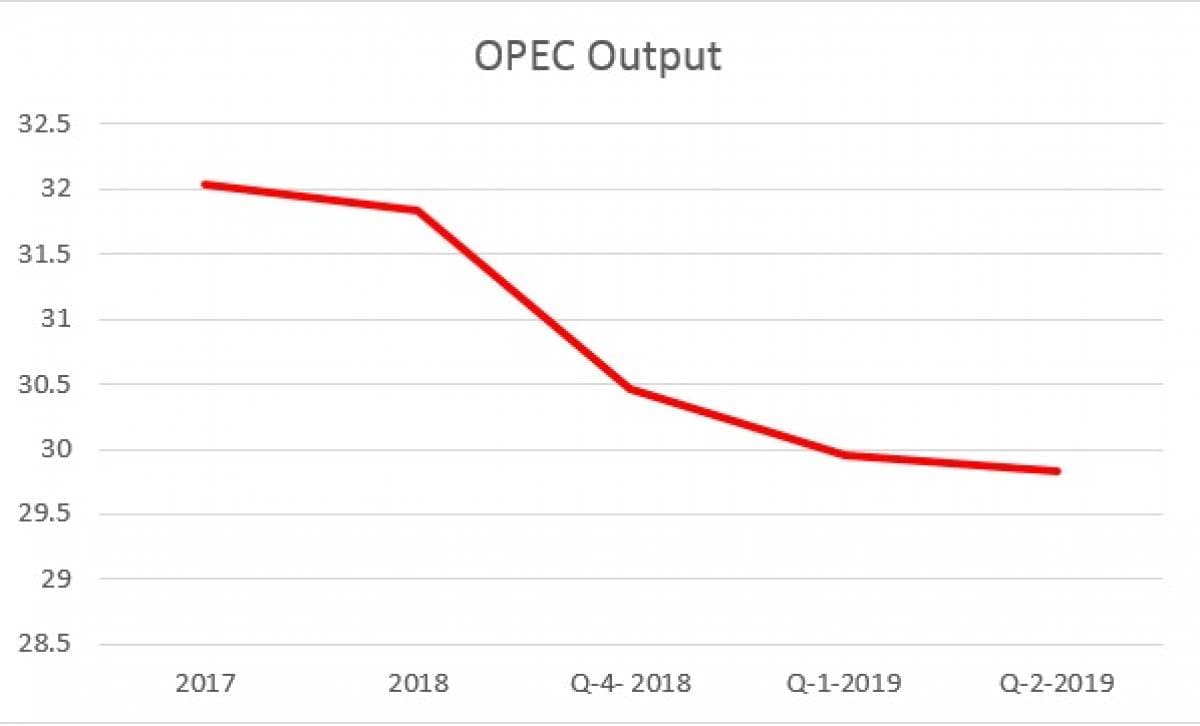
For the last couple of years OPEC has voluntarily withdrawn first, a half a million barrels a day from the market to shore up the price. When that didn’t work, it went to a million barrels a day, and then to 1.4 million. The graph below reflects that fairly well. Saudi Arabia has taken the bulk of those cuts, but some of it is reflective of some OPEC members simply being unable to pump their quota. Here again, the data is not supportive of any ability of the cartel to fill a gap of a million barrels a day or more.
OPEC monthly report
OPEC
The troubles of some of these countries have received a lot of press in recent times for various reasons unique to their own situations. As we all know, Venezuela, Libya, and Iran will not be ramping up much anytime soon.
Inside the cartel, that leaves Saudi to make up any shortfall. They are famous for claiming that they have several million barrels a day of excess capacity to do just that. That may indeed be true. But, in recent times rumors to the contrary have been making the rounds. Rumors that didn’t get a lot of traction as there was no way to prove for or against. Until recently during the roadshow for the ARAMCO-IPO.
In conjunction with the ARAMCO IPO, the proverbial camel got to stick its “nose under the tent”. Field production data of the massive Ghawar oil field was observed by third parties for the very first time. It was revealed that Ghawar has entered a sharp decline in recent years, and even secondary and tertiary recovery methods will not restore it to greatness.
So, absent a new find to replace Ghawar, the Saudis may be more talk than substance when it comes to restoring oil production.
Your takeaway: Yield over Growth
Over all I think bullish and bearish indicators for oil pretty much balance each other out for the coming week. Absent a big concession from the Chinese, and the Iranians deciding they really don't want to enrich after all, the inventory reports from the API and EIA will drive the market this week.
Last week I forecast another mild draw for this week, and fortune smiled on with the API report showing a draw of 1.4 mm barrels from crude stocks. Here was my comment-
“I think we should see another draw, perhaps not as big as the prior week’s given the shut-ins for Hurricane Barry, but a draw of some level.”
The EIA report doubled that amount, but the market decided it cared more about a cooling of tensions between the U.S. and Iran, and oil tanked mightily the first couple of days of the week of July, 16th.
This is a financial article, so we need to talk about some stocks. How to position your portfolio to take advantage of market reaction to last week’s oil price movements?
I am still looking for yield over growth at present. Growth is elusive these days, coming in fits and starts. The oil majors and service companies have all made significant moves up in the last few weeks. I am leery of adding to or opening new positions at these levels for the OSVs. They are simply too volatile.
Yahoo Financials, Chart by author
Yahoo Financials, Chart by author
That brings me back to the two Super Majors that I follow closely, Shell, RDS.A, B; and BP, BP. These two are currently on sale in my view. If you track them over time, they rarely offer a six percent yield, and when they do it doesn’t last for long. I think it is the smartest play in the energy space at the present time.
Summary
Things that we have taken for granted in shale, like eternal growth are coming into well-deserved question. The facts are still being generated, but as we have shown here the data suggests shale’s best days may be in the rear view.