Friday, August 23, 2019
1. Shale ekes out slight positive cash flow
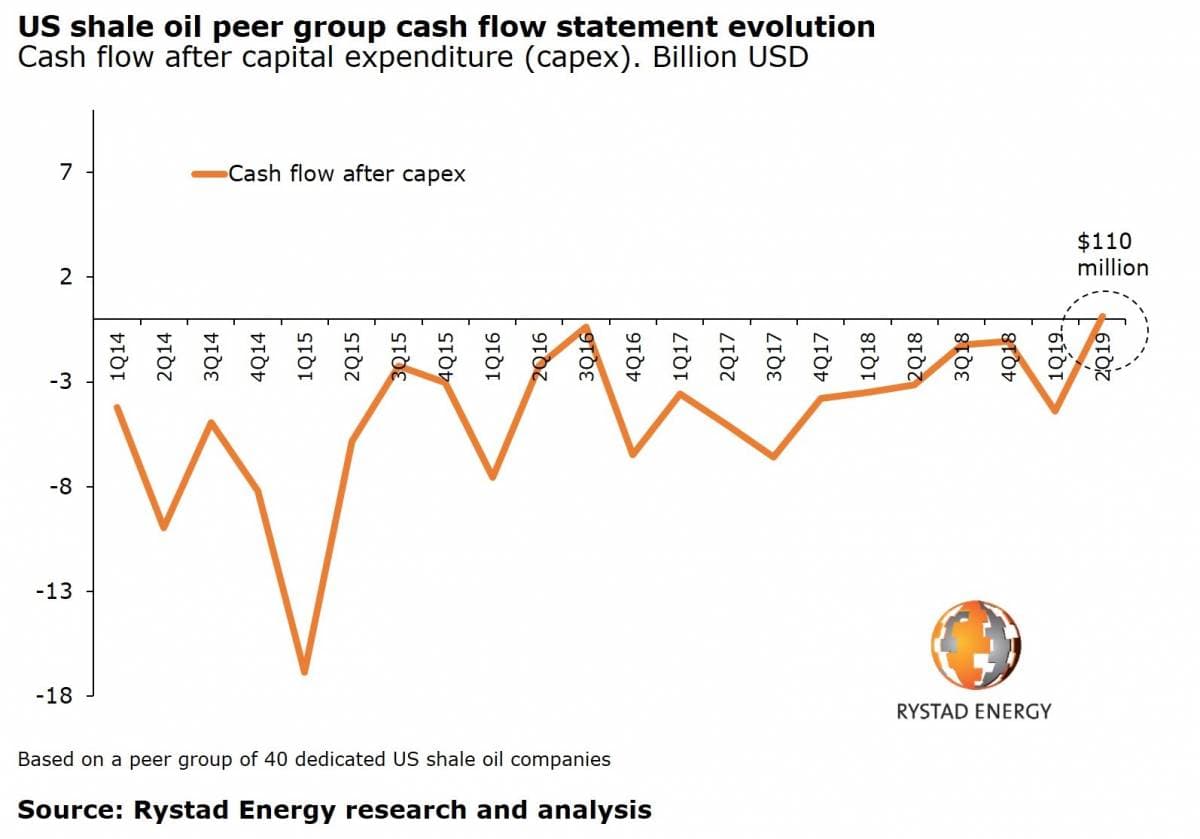
- The U.S. shale industry may have posted a very slight positive cash flow figure for the second quarter, depending on the companies included in the analysis. The swing into positive territory puts the industry into a novel position, after years of hefty red ink.
- According to Rystad Energy, a survey of 40 U.S. shale companies revealed a $110 million in positive cash flow in the second quarter. “That is an industry first,” Rystad Energy senior analyst Alisa Lukash said in a statement. “The five dollar increase in the average WTI oil price from the first to the second quarter of 2019, coupled with operators’ efforts to keep spending within their initial budgets, resulted in a slight surplus of adjusted CFO for total capex.”
- Cash flow is now paramount, as investors grow skeptical of shale. No company has made a public offering since 2017, and new bond issuance fell to just $4.8 billion in the first half of 2019, down 70 percent from the $16.4 billion semiannual average over the last five years.
- A separate survey by IEEFA and the Sightline Institute found $26 million in positive cash flow from 29 shale companies in the second quarter. “There were winners and losers this quarter, but overall, the oil and gas sector is still underperforming on virtually every financial measure,” said Clark Williams-Derry from Sightline Institute.
2. Metals struggle. Except for nickel
-…
Friday, August 23, 2019
1. Shale ekes out slight positive cash flow

- The U.S. shale industry may have posted a very slight positive cash flow figure for the second quarter, depending on the companies included in the analysis. The swing into positive territory puts the industry into a novel position, after years of hefty red ink.
- According to Rystad Energy, a survey of 40 U.S. shale companies revealed a $110 million in positive cash flow in the second quarter. “That is an industry first,” Rystad Energy senior analyst Alisa Lukash said in a statement. “The five dollar increase in the average WTI oil price from the first to the second quarter of 2019, coupled with operators’ efforts to keep spending within their initial budgets, resulted in a slight surplus of adjusted CFO for total capex.”
- Cash flow is now paramount, as investors grow skeptical of shale. No company has made a public offering since 2017, and new bond issuance fell to just $4.8 billion in the first half of 2019, down 70 percent from the $16.4 billion semiannual average over the last five years.
- A separate survey by IEEFA and the Sightline Institute found $26 million in positive cash flow from 29 shale companies in the second quarter. “There were winners and losers this quarter, but overall, the oil and gas sector is still underperforming on virtually every financial measure,” said Clark Williams-Derry from Sightline Institute.
2. Metals struggle. Except for nickel

- The deterioration in the global economy, made worse by the U.S.-China trade war, has soured the outlook for base metals across the board.
- “Market sentiment has been strongly linked to the trajectory of US-China trade talks and the threat of further tariffs and counter-tariffs has clouded the economic outlook,” Standard Chartered wrote in a note.
- Copper prices are under pressure, despite a growing supply deficit.
- “The only metal forecast we have revised up is nickel, to USD 13,447/t from USD 12,916/t previously in 2019 and USD 14,630/t (from USD 13,500/t) in 2020, partly to mark to market after recent gains but also to reflect the heightened supply uncertainty stemming from Indonesia’s mineral ore export ban and its timing,” Standard Chartered concluded.
3. WTI-Brent converge on Permian pipeline startups

- The recent inauguration of the Cactus II pipeline has ramped up midstream capacity between the Permian and the Gulf Coast. A few more pipelines are expected to come online in the coming months.
- The expanded takeaway capacity has helped narrow the price differential between WTI and Brent. The WTI discount has narrowed by $6 per barrel since May, and WTI is now trading at its closest point to Brent since early 2018.
- Notably, the differential has narrowed across the futures curve, on expectations that the Permian will have adequate pipeline capacity for the next few years, and also likely on the expectation of a shale slowdown.
- “The move at the front of the curve can be partly attributed to new pipeline start-ups in the Permian basin, but longer-dated spreads have strengthened as well,” Bank of America Merrill Lynch wrote in a note. “The near parallel shift higher in forward contracts has pushed 2020 WTI-Brent spreads below -$5/bbl on average. We have long called for tighter WTI-Brent spreads, though the recent move is admittedly faster and larger than anticipated. With the move, backwardation in WTI has re-emerged and now extends all the way into 2021.”
4. Shale has problems, but industry still posts productivity gains

- The problems in the shale patch have become closely scrutinized by investors and analysts. The recent admission by Concho Resources (NYSE: CXO) that its densely-packed 23-well project proved to be a disappointment raised concerns that the shale industry writ large was running up against limits.
- But not everyone agrees. “Recent E&P performance results and commentary from industry experts have caused concern over the end of productivity gains in the US shale basins,” Bank of America said. “We are of the opposite view and think that service efficiency (Chart 3) and well level productivity continue to improve.”
- The investment bank said that drilling efficiencies have improved 14 percent this year, and frac efficiencies are up 11 percent. Well productivity is also up, in part due to longer laterals.
- “Early indications for 2019 wells show strong performance versus 2018 when looking at 3 month [initial production rates],” Bank of America said. “This is particularly evident in the Permian, where most of the development activity has been concentrated in recent years.”
- The improvements have allowed shale drillers to do more with less.
5. Dollar strength risks global slowdown

- The ICE Dollar Index is up 11 percent since 2018, and the rate cuts from multiple central banks in just the last few weeks point to the economic and monetary risk from a strong greenback.
- China let its currency depreciation in response to U.S. tariffs, prompting a succession of rate cuts from India, New Zealand, Thailand and Mexico as central banks try to offset the weaker yuan.
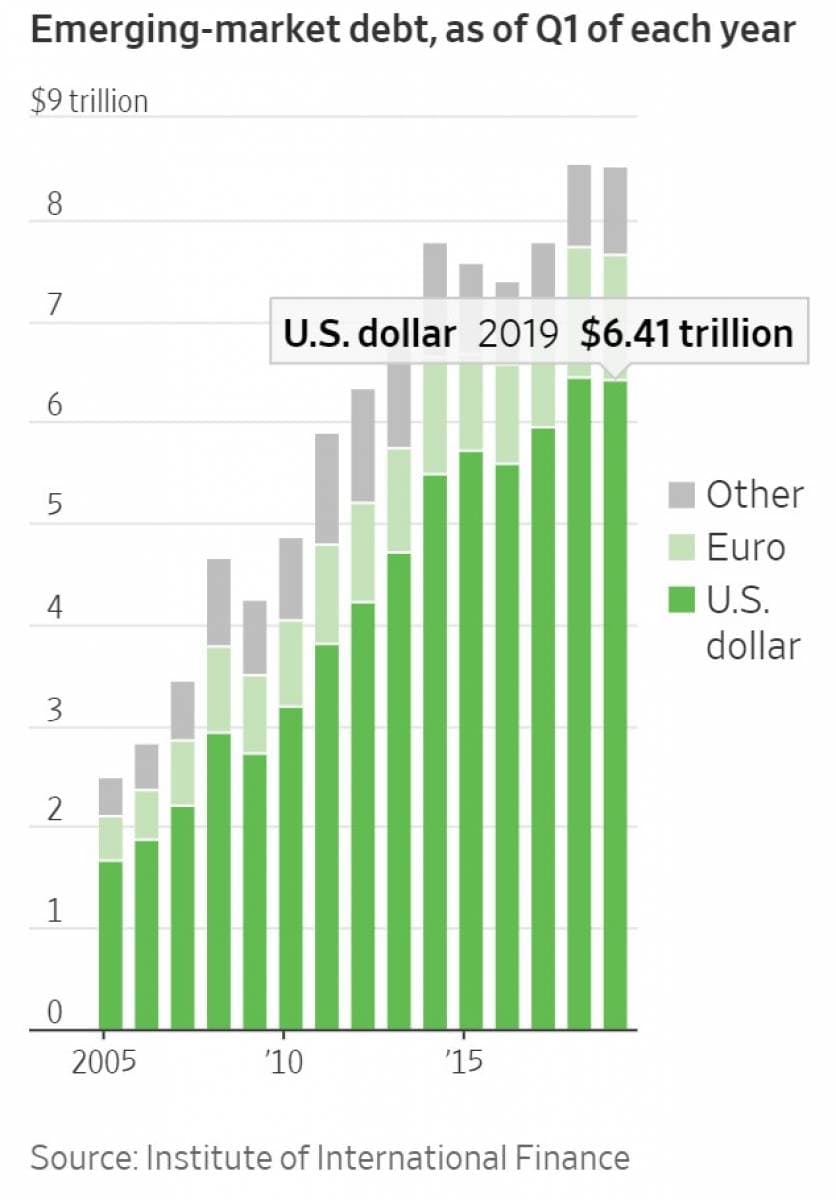
- The dollar is stronger in relation, and that increases the pain for dollar-denominated debtors around the world.
- Dollar-denominated debt in emerging market companies and governments soared to $6.4 trillion at the end of the first quarter, up from $2.7 trillion a decade ago.
- A strong dollar also depresses commodities demand and prices.
- Ultimately, a dollar that is too strong creates risks for the global economy.
6. EV demand for metals set to soar

- The EV revolution is just getting started, which means demand for metals is forecasted to skyrocket.
- In the short run, prices have collapsed. Spot prices of lithium carbonate have declined by a whopping $7,000 per ton since June 2018, according to Wood Mackenzie. A combination of rising supply and a deterioration in the macroeconomic environment drove prices down.
- “Despite strong growth in demand on the horizon, there’s not yet much for investors to get excited about,” WoodMac said. “Meeting demand is not a challenge for key metals at present. In many cases supply is chasing demand.”
- However, if and when EV penetration rises above 10 percent, that is “a different matter altogether,” WoodMac said.
- “Are the current falling prices and weak sentiment setting the world up for a crunch down the road?” WoodMac wonders.
7. Solar prices continue to fall

- The global average spot price for both monocrystalline and multicrystalline solar PV modules declined by 27 percent and 26 percent, respectively, between December 2017 and July 2018, according to the EIA.
- Prices have been relatively stable since mid-2018, however.
- Cost declines have more than offset solar tariffs imposed by the Trump administration.
- In the first quarter of 2019, the U.S. surpassed 2 million installations, just three years after hitting the first 1 million. By 2021, the industry is expected to hit 3 million, and by 2023 will have installed 4 million systems.


