OPEC+ took action to cut supplies from the market last week and threw themselves and U.S. frackers a substantial short-term lifeline. In terms of price action, the 1.2m bpd cut (to begin in January) seems to be mostly in line with what the market expected as Brent crude has flattened out near $60/bbl.
The tepid price movement following the announcement of the deal highlights both the bloated status of physical balances as well as the market’s expectation that U.S. producers will comfortably be able to keep a lid on prices in the near term. Traders are highly reluctant to resume the bullish enthusiasm they felt in early 2018 and have kept time spreads securely in contango. Analysts seem to feel similarly with the EIA reducing their 2019 Brent forecast to $61/bbl while Citi sees Brent trading in a $55-$65 range next year.
Market skepticism related to OPEC and OPEC+ production cuts isn’t new. Decisions made by the group to balance oil supplies with demand have always been met suspiciously as traders have questioned whether the group would actually self-impose the cuts they agreed to. This was certainly true the last time cuts were made in 2016 and prices slowly adjusted higher as data revealed that the group was highly disciplined in hitting quotas. What seems strikingly different this time around, however, is that the skepticism related to OPEC+ cuts seems to be that they lack the efficacy to shock the market higher because so many of the cut barrels will be replaced…
OPEC+ took action to cut supplies from the market last week and threw themselves and U.S. frackers a substantial short-term lifeline. In terms of price action, the 1.2m bpd cut (to begin in January) seems to be mostly in line with what the market expected as Brent crude has flattened out near $60/bbl.
The tepid price movement following the announcement of the deal highlights both the bloated status of physical balances as well as the market’s expectation that U.S. producers will comfortably be able to keep a lid on prices in the near term. Traders are highly reluctant to resume the bullish enthusiasm they felt in early 2018 and have kept time spreads securely in contango. Analysts seem to feel similarly with the EIA reducing their 2019 Brent forecast to $61/bbl while Citi sees Brent trading in a $55-$65 range next year.
Market skepticism related to OPEC and OPEC+ production cuts isn’t new. Decisions made by the group to balance oil supplies with demand have always been met suspiciously as traders have questioned whether the group would actually self-impose the cuts they agreed to. This was certainly true the last time cuts were made in 2016 and prices slowly adjusted higher as data revealed that the group was highly disciplined in hitting quotas. What seems strikingly different this time around, however, is that the skepticism related to OPEC+ cuts seems to be that they lack the efficacy to shock the market higher because so many of the cut barrels will be replaced by North American producers. Traders seem to take it at face value (amazingly!) that the cartel will reduce production by more than 1m bpd, but it doesn’t seem to be injecting a high degree of bullish risk into the market. Instead, options markets, time spreads and hedge fund positioning all seem preoccupied with the bearish risk created by the Trump/Xi trade war, record U.S. crude production and the maturation of the global economic expansion.
Markets are correct in wearing a bearish concern related to U.S. producers. U.S. crude output has averaged 10.75m bpd in 2018 representing a 1.4m bpd y/y increase and a 2m bpd increase from 2016. Increased/flat prices- a gift from OPEC- should allow more producer hedging for 2019 and 2020. WTI 2019 and 2020 calendar swaps both traded near $52/bbl this week and we expect to see incremental hedging from producers near $55/bbl and $60/bbl which should ultimately weigh on prices.
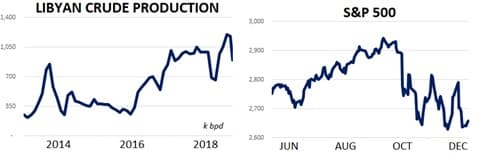
The extent that the market narrative has shifted from bullish to bearish in just three short months is still remarkable to us. As a result of this shift the overwhelmingly bearish mood in the market may be the best bullish argument in the short term. Hedge funds have cut length in crude oil derivatives to the bone while adding fresh short positions and markets are increasingly pricing in more negative news flows from US/China trade relations. What if Libya (or another politically fragile exporter) continues to suffer outages as they did this week? What if Trump realizes he needs to cool the trade rhetoric to improve his election chances and trade relations improve? There are still some bullish risks in the market and traders seem ill positioned to deal with them after more than two months of aggressive selling. We mustn’t forget that oil markets can go higher, too!
Quick Hits

- OPEC+ has at least temporarily put the brakes on oil’s two month losing streak by agreeing to cut production by 1.2m bpd for the first half of 2019. In terms of contribution, OPEC’s 15 members will reduce by about 800k bpd (led by the Saudis) while non-OPEC exports will kick in about 400k bpd (led by Russia.) Brent mostly traded in a $60-$62 range this week while WTI ran from $51-$53.
- Beyond their production cuts, OPEC offered another bearish assessment of the market in a report this week noting that “Rising trade tensions, monetary tightening and geopolitical challenges are among the issues that skew economic risks even further to the downside in 2019… The upside appears limited.”
- OPEC may have recently handed US producers a lifeline but there are still signs of stress in the market. Barclays’ Energy High Yield average topped 5.70% this week- up from just 3.50% in October.
- Hedge funds persisted as large net sellers of ICE Brent and NYMEX WTI futures and options last week cutting net length by 18% w/w in both contracts. Combined net length held by speculators is lower by 69% since September and currently stands at its lowest mark since 2015.
- Time spreads joined in taking a break from their recent bearish action but remain comfortably in contango. For WTI, the prompt 6-month spread is yielding roughly 15-cents / month of contango while the same maturity in Brent is offering about 12-cents / month. Both structures will likely push more barrels into storage as traders look to store barrels and sell them at later-dated prices.
- Libya added to upward pressure on prices this week by declaring force majeure at its largest producing field- the 300k bpd Sharara.
- Stock markets, like oil, flattened out this week and held on to recent losses. S&Ps traded near 2,650 which was essentially flat on the year and lower by more than 10% since early October.
- Bond markets are still flashing warning signs as the yield curve on US government bonds moved closer to flat. There is growing speculation that the US Fed may actually have to lower interest rates in late 2019 or 2020.
- As for FX, the US Dollar Index moved slightly higher due largely to EUR/USD weakness.
DOE WRAP UP
U.S. crude stocks fell by more than 2m bbls last week to 442m bbls and are flat y/y. PADD III inventories increased to 233m bbls and are higher y/y by about 5% while PADD II stocks are lower y/y by about 8%.
- Inventories in the Cushing, Oklahoma delivery hub increased by 1.15m bbls to 39.4m bbls marking their 13th straight w/w increase. Cushing stocks have increased by more than 40% since September and currently stand at an 11-month high.
- Crude oil exports fell sharply from over 3m bpd to 2.3m bpd (1.9m bpd avg. in 2018) while imports ticked slightly higher w/w to 7.4m bpd (7.9m bpd avg. in 2018.)
- Production fell by 100k bpd to 11.6m bpd. The U.S. crude oil rig count fell by 10 to 877 and is higher by 130 year on year.
- As for demand, U.S. refiners processed 17.4m bpd (flat w/w) for a y/y increase of about 400k bpd.
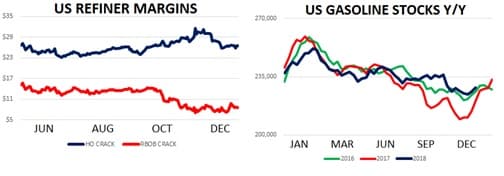
- The WTI 321 crack is giving refiners a yield of about $14/bbl. Refiners continue to stick with distillates as much as possible as the gasoline crack is stuck at $9/bbl while heating oil cracks are trading $26/bbl. Overseas, the gasoil / brent crack is giving European and Asian refiners roughly $15/bbl.
- For product markets, US gasoline stocks added about 2.1m bbls w/w and are higher y/y by about 3%. Gasoline inventories in the US Mid Atlantic (where the NY Harbor trading hub is located) are flat y/y at 30.5m bbls. Domestic gasoline consumption + exports totaled 10.3m bpd last week and is averaging 10.1m bpd in 2018 which is higher y/y by about 100k bpd.
- U.S. distillate inventories fell by 1.5m bbls w/w to 124m bbls and are lower y/y by 5%.