OPEC and its allies including Russia, agreed Friday to deepen output cuts in an effort to trim the global supply and stabilize prices. The move is designed to combat stagnant global economic growth blamed on the U.S.-China trade war. OPEC+ stopped short of pledging action beyond the first quarter of 2020, causing analysts and traders to question the impact of the latest curbs.
According to reports, the cuts will expand the existing agreement by an extra 500,000 barrels per day (bpd) reduction in the first quarter next year, through tighter compliance and some adjustments. OPEC’s current agreement is a supply cut of 1.2 million bpd and the increased amount represents about 1.7% of global oil output.
Saudi Arabia’s Energy Minister Prince Abdulaziz bin Salman also told reporters that its quota would be an additional 167,000 barrels per day through March 2020. He also said that the kingdom would continue to exceed its quota by 400,000 barrels a day, which means the overall production cut will actually be closer to 2.1 million barrels a day.
Weekly Technical Analysis
Weekly January WTI Crude Oil Technical Analysis
Weekly Swing Chart Technical Analysis
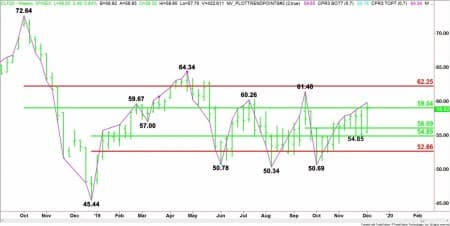
The main trend is up according to the weekly swing chart. A trade through $61.48 will reaffirm the uptrend.
The main trend will change to down on a move through the last swing bottom at $50.69. This is highly unlikely, however, the market is up nine weeks from its last main bottom.…
OPEC and its allies including Russia, agreed Friday to deepen output cuts in an effort to trim the global supply and stabilize prices. The move is designed to combat stagnant global economic growth blamed on the U.S.-China trade war. OPEC+ stopped short of pledging action beyond the first quarter of 2020, causing analysts and traders to question the impact of the latest curbs.
According to reports, the cuts will expand the existing agreement by an extra 500,000 barrels per day (bpd) reduction in the first quarter next year, through tighter compliance and some adjustments. OPEC’s current agreement is a supply cut of 1.2 million bpd and the increased amount represents about 1.7% of global oil output.
Saudi Arabia’s Energy Minister Prince Abdulaziz bin Salman also told reporters that its quota would be an additional 167,000 barrels per day through March 2020. He also said that the kingdom would continue to exceed its quota by 400,000 barrels a day, which means the overall production cut will actually be closer to 2.1 million barrels a day.
Weekly Technical Analysis
Weekly January WTI Crude Oil Technical Analysis

Weekly Swing Chart Technical Analysis
The main trend is up according to the weekly swing chart. A trade through $61.48 will reaffirm the uptrend.
The main trend will change to down on a move through the last swing bottom at $50.69. This is highly unlikely, however, the market is up nine weeks from its last main bottom. This makes it vulnerable to a higher-high, lower-close, also known as a closing price reversal top. This chart pattern won’t change the trend to down, but it will indicate the selling greater than the buying at current price levels.
The minor trend is also up. A trade through $54.85 will change the minor trend to down. This will shift momentum to the downside.
The main range is $72.64 to $45.44. Its 50% to 61.8% retracement zone at $59.04 to $62.25 is controlling the longer-term direction of the market.
The minor range is $45.44 to $64.34. Its retracement zone at $54.89 to $52.66 is major support.
The short-term range is $61.48 to $50.69. Its 50% level at $56.09 is also support.
The price action over the past five weeks indicates the strongest support lies between the two 50% levels at $56.09 to $54.89.
Weekly Swing Chart Technical Forecast
Based on this week’s price action, the direction of the January WTI crude oil market the week-ending December 13 is likely to be determined by trader reaction to the main 50% level at $59.04.
Bullish Scenario
A sustained move over $59.04 will indicate the presence of buyers. If this is able to generate enough upside momentum then look for the rally to possibly extend into the main top at $61.48, followed by the main Fibonacci level at $62.25.
Bearish Scenario
A sustained move under $59.04 will signal the presence of sellers. This could trigger an acceleration to the downside with the next two targets the 50% levels at $56.09 and $54.89.
Conclusion
Crude oil is getting support this week from optimism that the U.S. and China will reach a trade deal in a timely manner, the OPEC+ deal to increase and extend production cuts and a stronger-than-expected U.S. jobs report, which indicates a resilient economy.
The trade talk progress and the strong jobs report are helping to ease worries over demand. The production curb increase and extension could help alleviate some of the oversupply concerns.
Next week, the main focus will shift back to the trade deal. Both the United States and China are under pressure to reach at least a partial trade deal by December 15. This is the date new tariffs against China are expected to kick-in. Given this situation, a trade deal could be reached by the end of next week. The anticipation of this event should be enough to keep the crude oil market underpinned.


