


It is impossible to tell the whole oil story, but perhaps I can offer a few insights regarding where we are today.
[1] We already seem to be back to the falling oil prices and refilling storage tanks scenario.
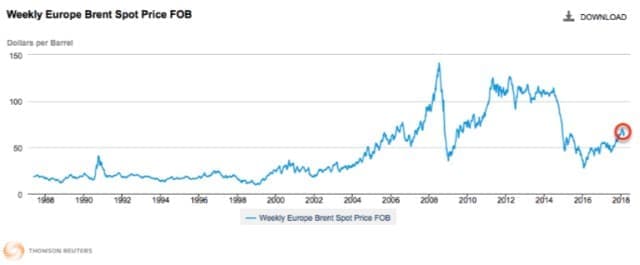
U.S. crude oil stocks hit their low point on January 19, 2018 and have started to rise again. The amount of crude oil fill has averaged about 365,000 barrels per day since then. At the same time, prices of both Brent and WTI oil have fallen from their high points.
(Click to enlarge)
Figure 1. Average weekly spot Brent oil prices from EIA website, with circle pointing to recent downtick in prices.
Many people believe that the oil problem, when it hits, will be running out of oil. People with such a belief interpret a glut of oil to mean that we are still very far from any limit.
[2] An alternative story to running out of oil is that the economy is a self-organized system, operating under the laws of physics. With this story, too little demand for oil is as likely an outcome as a shortage of oil.
Oil and energy products are used to create everything, even jobs. If all humans have is energy from the sun, plus the energy that all animals have, then humans would be much more like chimpanzees. All humans would be able to do is gather plant food and catch a few easy-to-catch animals (earthworms and crickets, for example). They certainly could not extract oil or find uses for it.
It takes a self-organized economy to support the extraction and sale of energy products. We need a complex web that includes:
- Equipment to extract the oil
- Training for engineers and other workers
- Devices that use oil, such as vehicles, farm equipment, road paving equipment
- A financial system to enable transactions to purchase oil
- Buyers with jobs that pay well enough that they can afford to buy goods made with oil
The things that go wrong with this economy can be on the buyers’ end of the economy. Buyers can have jobs, but these jobs may not pay well enough for the buyers to afford the output of the economy. A falling share of the population may be able to afford cars, for example.
[3] It is possible that a recent rapid increase in oil supply is contributing to the current mismatch between supply and demand.
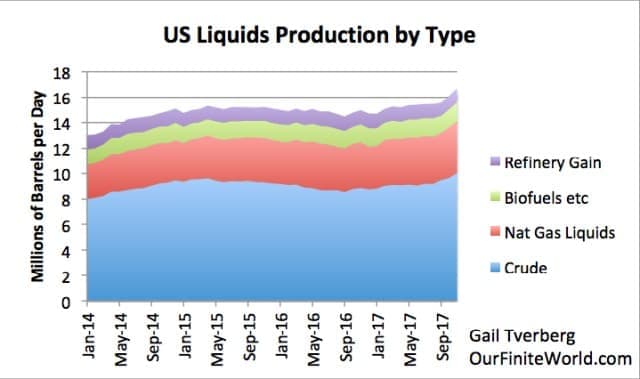
Data of the U.S. Energy Information Administration indicates that U.S. oil supply has recently begun to surge. It is not just crude oil production that is higher. Natural gas liquid production is higher as well. As a result, Total Liquids production is reported to have been more than 16 million barrels per day in November 2017.
(Click to enlarge)
Figure 2. US Liquids Production, based on International Energy Data provided by the US EIA.
Oil production of the rest of the world has been relatively flat, as planned.

(Click to enlarge)
Figure 3. World excluding the US oil production by type, based on EIA International Energy data through November 2017.
Total world production, combining the amounts on Figures 2 and 3, set a new record of 99.1 million barrels of oil per day for November 2017, based on EIA data. This level is above the November 2016 level, which was the previous record at 98.9 million barrels per day. Related: U.S. Shale’s Dirty Secret
At this high level of production, it is not surprising that the economy cannot absorb the full amount of extra supply.
There are also a number of issues that affect buyers’ demand for oil.
[4] The percentage of U.S. residents who can afford to buy a new automobile or light truck seems to be falling over time.
If we look at the number of autos and trucks sold in the U.S., per 1000 population, we see a pattern of falling humps, as a smaller and smaller share of the population can afford a new car or light truck, each year. The big drops occur during the gray recessionary periods marked on the chart.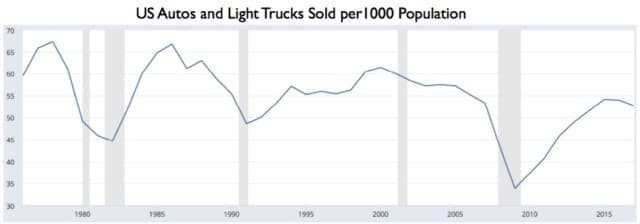
(Click to enlarge)
Figure 4. Figure showing US Passenger Cars and Light Trucks Purchased per Year per 1000 Population. Original graph by FRED (Federal Reserve of St. Louis). Retitled by author, because units were confusing on original chart.
The first peak came in 1978, at 67.3 units. The second, slightly lower peak came in 1986, at 66.7. The third peak came in 2000 at 61.5 units. The fourth peak came in 2015, at 51.6 units. Early 2018 amounts suggest that the trend in units sold per 1000 population will continue its downward trend.
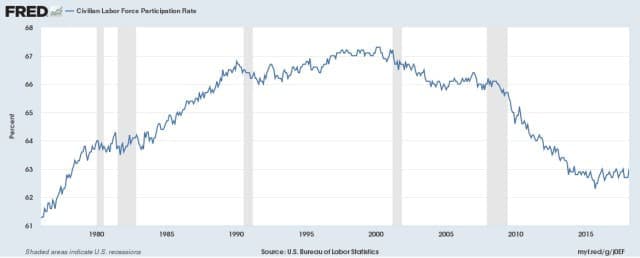
Part of what is happening is that vehicles are becoming longer-lasting, so that there is not as much need to buy new cars frequently. But having a short-lived, cheap car has an advantage, if it makes cars available to a larger percentage of the total population. With a vehicle, a person has a much better ability to participate in the U.S. workforce. U.S. Labor Force Participation Rates peaked in about the year 2000, which is about the time of the third peak in affordability.
(Click to enlarge)
Figure 5. US Labor Force Participation Rate. Chart by FRED (Federal Reserve of St. Louis).
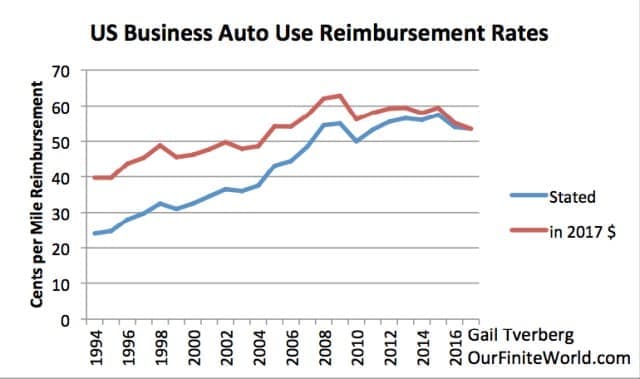
[5] There was a steep rise in the cost of auto ownership in the 1995- 2008 period. This has since fallen back, but the cost is still high relative to the wages of many workers.
One estimate of the cost of auto ownership is the reimbursement rate that the U.S. government allows businesses to pay workers who use their own cars for company business.
(Click to enlarge)
Figure 6. Auto reimbursement rates as compiled on this list. Amounts shown on “As Stated” basis, and also at the 2017 cost level, based on CPI Urban.
These costs peaked about 2008 and were reflected in high reimbursement rates for 2009 as well. More recently, buyers of cars have been helped by longer term loans and ultra-low interest rates. If interest rates rise at all, the share of people buying or leasing new vehicles can be expected to fall further from the level shown on Figure 4.
[6] Building homes also requires oil. There has been a sharp drop in U.S. home building, both on an absolute basis, and on a per capita basis, since 2008.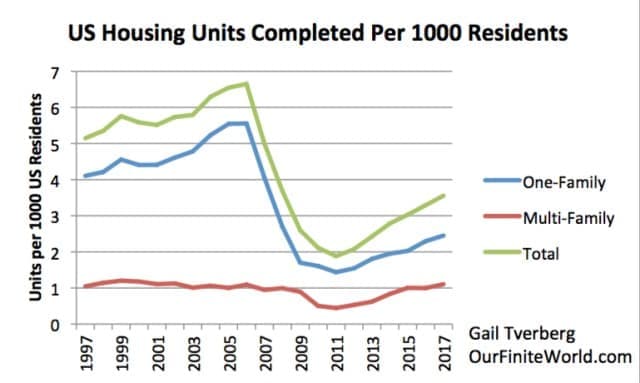
(Click to enlarge)
Figure 7. US Housing Units Completed, related to US population. Population from Census Bureau; population from UN 2017 population summary.
Building homes is part of oil demand. It takes oil to transport all of the materials used (lumber, siding, wiring, pipes, appliances) to the place where the house will be built. Furthermore, many of the materials used in building a home are produced using petroleum products.
The number of homes built depends on the number of new households that can afford a separate place to live. The low level of building makes it look as if the economy is still seeing a pattern of young adults living with their parents much longer than in the past. If buildings are to be replaced every 75 years, my calculation suggests that about 6 housing units per 1000 residents need to be built each year. About 2.5 units per thousand are needed, just to keep up with rising population, if upgrading and remodeling can be done almost indefinitely.
The fact that there is little home building reduces the number of jobs available in the building industry. The lack of jobs in this industry helps hold down the demand for oil, because these workers would use their wages to buy goods for themselves, such as food and vehicles. Food is grown and transported using vehicles powered by oil.
The lack of home building also contributes to the nation’s homelessness problem. If there were plenty of inexpensive apartments, there would be fewer homeless people.
[7] There is no longer an oil price at which both oil exporters and oil importers are satisfied. Oil prices today are too low for oil exporters.
I started writing about oil producers complaining that oil prices were too low in early 2014. At that time, oil companies were looking back at prices of over $100 per barrel in 2013. They were saying that $100+ prices were too low to provide adequate funds for reinvestment in new fields. Now prices are in the $65 range, which is even farther below the desired level.
Oil exporters are especially unhappy about today’s low prices, because they need high prices in order to collect needed tax revenue. This is why OPEC members and Russia have been holding back production. The plan is to deplete the glut of oil in storage, and thus get prices up.
It is not at all clear, however, that consumers in oil importing countries can really withstand higher prices. The fact that Brent oil prices could only stay above $70 per barrel for one week on Figure 2 (in the red circle), suggests that consumers in major oil importing countries cannot really withstand oil prices at this high level. I have observed previously that a sustainable price, without adding a huge amount of debt each year, is only about $20 per barrel.
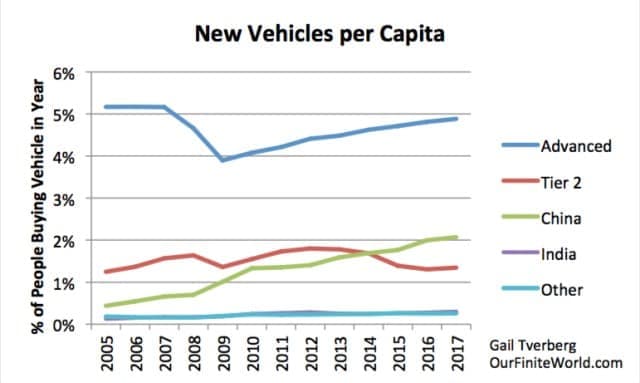
[8] If we analyze vehicle purchases by country, we can see that low oil prices since 2014 seem to be helping major oil importers but are hurting Tier 2 countries that are commodity-dependent.
(Click to enlarge)
Figure 8. New vehicles (private passenger and commercial combined) purchased per capita for selected groupings of countries. Amounts shown are from OICA estimates by country.
In this chart, the grouping of Advanced Economies includes:
- USA
- Europe
- Japan
- Canada
- Australia
For this grouping, growth in auto sales is again rising, but has not regained its prior level. This is somewhat similar to the indications in Figure 4, for the U.S. only, looking at cars and light trucks. The main difference is in the last two years. Changes in currency relativities may be helping recent vehicle sales for the other countries in the grouping.
On this chart, the Tier 2 grouping includes:
- Brazil
- Russia
- South Africa
- South Korea
- Malaysia
- Mexico
This group includes several oil and other resource dependent countries. South Korea is perhaps more like the industrial countries in the first grouping. This grouping shows a downturn in the purchasing of vehicles in the last three years, when commodity prices have been depressed. If oil prices were higher, this group would probably be buying more vehicles.
Figure 8 shows that China’s auto sales have been growing rapidly. In fact, China has surpassed the Tier 2 average in per capita sales. In the past year, China’s growth in auto sales has flattened. But with China’s huge population, the absolute number of vehicles sold is still very high: 29.1 million vehicles, compared to 17.6 million for the United States, and compared to 20.9 million for Europe.
India and the Rest of the World account for surprisingly few vehicles sold. On Figure 8, their lines overlap at the bottom of the chart.
[9] The push toward raising interest rates and selling QE securities will tend to reduce oil prices and add to the oil glut.
I wrote about some of the issues involved in Raising Interest Rates Is Like Starting a Fission Chain Reaction. When interest rates are higher, economies are pushed in the direction of recession. All kinds of discretionary spending are reduced. Use of oil will almost certainly be reduced. This could lower oil prices significantly, as it did in 2008 (Figure 1).
[10] To a significant extent, China has been helping hold up world oil consumption, with its rapidly growing economy. It is hitting headwinds now, however.
The International Monetary Fund recently showed an exhibit indicating how China’s debt is growing very rapidly, but its growth in output is slowing. The combination could very easily lead to a credit crisis.
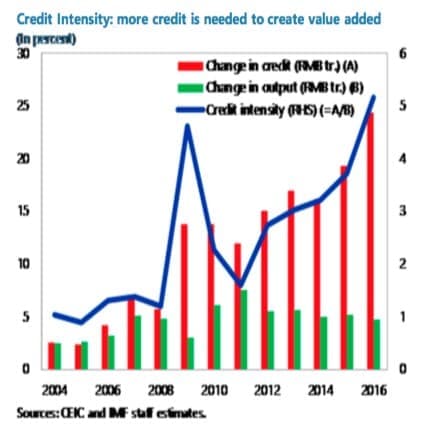
Figure 9. Exhibit from IMF Working Paper called Credit Booms: Is China Different?
Now, the rest of the world depends on China for many imported goods. If China should have problems, it would indirectly affect oil demand elsewhere as well.
Even China’s recent ban on importing certain types of materials for recycling can be expected to have an adverse impact on oil demand. Very often, if a container is sent from China to the U.S. or to Europe, there will be no exported goods to send back to China, except for material for recycling. If China refuses to take recycling, containers will need to be returned empty.
Recycling generally needs to be subsidized. Part of what this subsidy is used for is to pay the cost of shipping material to be recycled to China. If China does not take the recycling, this payment for shipping materials in the otherwise-empty containers will not be made. The shipping company will need to charge exporters more for the one-way trip, if the shipping company is to be profitable. This higher cost, by itself, is a deterrent to trade. In many ways, the higher shipping cost is like a tariff.
[11] Conclusion.
My expectation is that the general direction of oil prices is likely downward, especially if interest rates rise. A major financial disruption of any kind would have a similar effect. Gluts of oil can be expected with lower prices.
Many groups, including the IEA, have been warning about oil shortages because of inadequate investment in new production. Oil shortages, and energy shortages in general, have a multitude of adverse impacts on economies. One of them is loss of jobs, because jobs require the use of energy, for example, to deliver goods in a truck. If many more people are unemployed, there is less demand for oil.
Related: Is Another Oil Price War Looming?
Thus, it is not at all clear that a shortage of oil leads to high prices; it may very well lead to lower prices. Many people are confused about this issue, because the word demand gives a misleading impression of the mechanism involved. Lack of demand comes from part of the population not being able to afford cars and homes. It also comes from cutbacks in government spending and from failing businesses. In an interconnected system, even failing banks tend to reduce oil demand.
Another adverse impact of oil and energy shortages tends to be fighting and wars. The fact that the U.S. seems to be raising its energy production, in apparent disregard for countries that have been trying to cut back, is likely to make some oil exporting countries quite angry. It could sow the seeds for another war.
Economists do not seem to understand that GDP growth rates don’t tell very much about the well-being of individual citizens in an economy. A major issue is wage disparity. If there are many very low wage people, there is likely to be downward pressure on the sale of automobiles, and on the purchase of petroleum products. Economists are likely to think everything is fine, up until a major crisis occurs.
By Gail Tverberg via www.ourfiniteworld.com
More Top Reads From Oilprice.com:
- Russia Could Pull The Plug On The OPEC Deal
- Heavy Sweet Crude Is Heading For A Supply Crisis
- Oil Prices Rise Despite Climbing Rig Count


The only reason oil could go higher is Aramco IPO and it's postponed.