


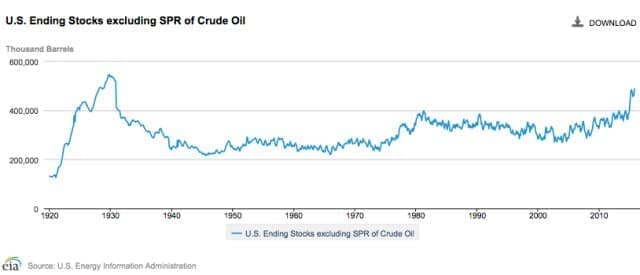
Today, we have a surplus of oil, which we are trying to use up. That has never happened before, or did it? Well, actually, it did, back around 1930. As most of us remember, that was not a pleasant time. It was during the Great Depression.
(Click to enlarge)
Figure 1. U.S. ending stocks of crude oil, excluding the Strategic Petroleum Reserve. Amounts will include crude oil in pipelines and in “tank farms,” awaiting processing. Businesses normally do not hold more crude oil than they need in the immediate future, because holding this excess inventory has a cost involved. Figure produced by EIA. Amounts through early 2016.
A surplus of a major energy commodity is a sign of economic illness; the economy is not balancing itself correctly. Energy supplies are available for use, but the economy is not adequately utilizing them. It is a sign that something is seriously wrong in the economy–perhaps too much wage disparity.
(Click to enlarge)
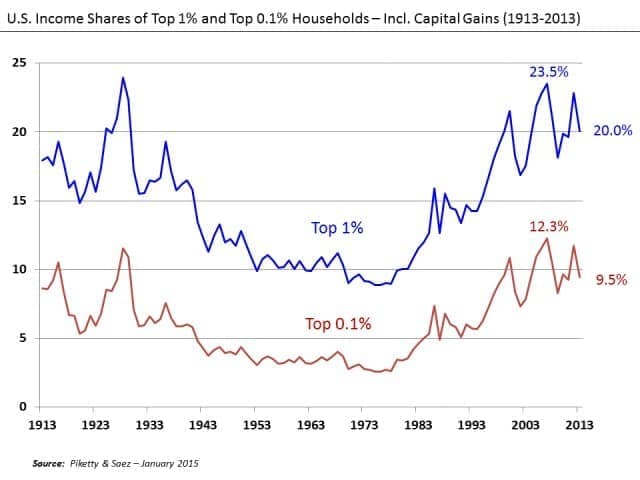
Figure 2. U. S. Income Shares of Top 10 percent and Top 1 percent, Wikipedia exhibit by Piketty and Saez.
If wages are relatively equal, it is possible for even the poorest citizens of the economy to be able to buy necessary goods and services. Things like food, homes, and transportation become affordable by all. It is easy for “Demand” and “Supply” to balance out, because a very large share of the population has wages that are adequate to buy the goods and services created by the economy.
It is when we have too much wage disparity that we have gluts of oil and food supplies. Food gluts happened in the 1930s and are happening again now. We lose sight of the extent to which the economy can actually absorb rising quantities of commodities of many types, if they are inexpensive, compared to wages. The word “Demand” might better be replaced by the term “Quantity Affordable.” Top wage earners can always afford goods and services for their families; the question is whether earners lower in the wage hierarchy can. In today’s world, some of these low-wage earners are in India and Africa, or have no employment at all.
What is Going Right, As We Enter 2018
[1] The stock market keeps rising.
The stock market keeps rising, month after month. Volatility is very low. In fact, the growth in the stock market looks rigged. A recent Seeking Alpha article notes that in 2017, the S&P 500 showed positive returns for all 12 months of the year, something that has never happened before in the last 90 years.
Very long runs of rising stock prices are not necessarily a good sign. According to the same article, the S&P 500 rose in 22 of 23 months between April 1935 and February 1937, in response to government spending aimed at jumpstarting the economy. By late 1937, the economy was again back in recession. The market experienced a severe correction that it would not fully recover from until after World War II.
The year 2006 was another notable year for stock market rise, with increases in 11 out of 12 months. According to the article,
Equity markets rallied amidst a volatility void in the lead-up to the Great Recession. Markets would make new all-time highs in late 2007 before collapsing in 2008, marking the worst annual returns (-37 percent) since the aforementioned infamous 1937 correction.
So while the stock market consistently rising looks like a good sign, it is not necessarily a good sign for market performance 6 to 24 months later. It could simply represent a bubble forming, which will later pop.
[2] Oil and other commodity prices are recently somewhat higher.
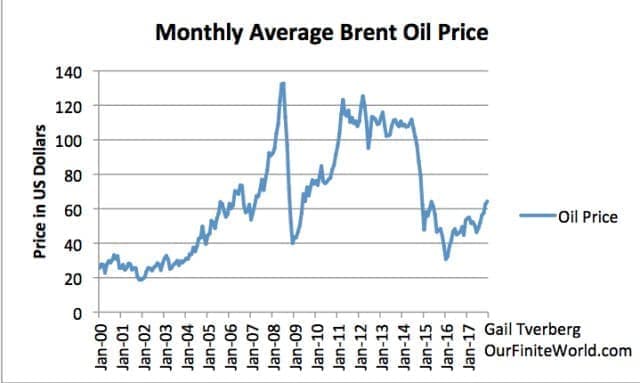
Recently, oil prices have been too low for most producers. Now, things are looking up. While prices still aren’t at an adequate level, they are somewhat higher. This gives producers (and lenders) hope that prices will eventually rise sufficiently that oil companies can make an adequate profit, and governments of oil exporters can collect adequate taxes to keep their economies operating.
(Click to enlarge)
Figure 3. Monthly average spot Brent oil prices, through December 2017, based on EIA data.
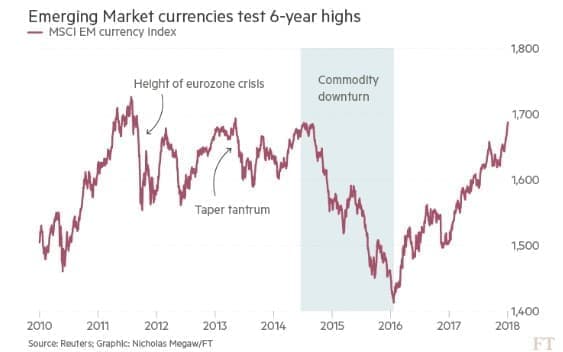
A major reason for the recent upward trend in commodity prices seems to be a shift in currency relativities for Emerging Markets.
(Click to enlarge)
Figure 4. Figure from Financial Times showing currency relativities based on the MSCI Emerging Market currency index.
While the currency relativities for emerging markets had fallen quite low when commodity prices first dropped, they have now made up most of their lost ground. This makes commodities more affordable in Emerging Market countries, and allows them to do more manufacturing, thus stimulating the world economy.
Of course, if China runs into debt problems, or if India runs into problems of some sort, or if oil prices rise further than they have to date, the run-up in currency relativities might run right back down again.
[3] U.S. tax cuts create a bubble of wealth for corporations and the 1 percent.
With low commodity prices, returns have been far too low for many corporations involved with commodity production. “Fixing” the tax law will help these corporations continue to operate, even if commodity prices remain low, because taxes will be lower. These lower tax rates are important in helping commodity producers to avoid collapsing as a result of low commodity prices.
The problem that occurs is that the change in tax law opens up all kinds of opportunities for companies to improve their tax situation, either by changing the form of the corporation, or by merging with another company with a suitable tax situation, allowing the combined taxes to be minimized. See this recent Michael Hudson video for a discussion of some of the issues involved. This link is to a related Hudson video.
Groups evaluating the expected impact of the proposed tax law did their evaluations as if corporate structure would remain unchanged. We know that tax accountants will help companies quickly make changes to maximize the benefit of the new tax law. This is likely to mean that U.S. governmental debt will need to rise much more than most forecasts have predicted.
In a way, this is a “good” impact, because more debt helps keep commodity prices and production to rise, and thus helps keep the economy from collapsing. But it does raise the question of how long, and by how much, governmental debt can rise. Will the addition of all of this new debt raise interest rates even above other planned interest rate increases?
[4] We have been experiencing artificially low oil prices since 2013. This helps the economic growth to be higher than it otherwise would be.
In February 2014, I published an article documenting that back in 2013, oil prices were too low for oil producers. If a person looks at Figure 4, oil prices were over $100 per barrel that year. Clearly, oil prices have been much too low for producers since that time.
Unfortunately, it looks like these artificially low oil prices may be coming to an end, simply because the “glut” of oil that developed is gradually being reduced. Figure 5 shows the timing of the recent glut of oil. It seems to have started early in 2014.

(Click to enlarge)
Figure 5 U.S. Stocks of crude oil and petroleum products (including Strategic Petroleum Reserve), based on EIA data.
If we look at the combination of oil prices and amount of oil in storage, a person can make a rough estimate of how this glut of oil might disappear. Quite a bit of it may be gone by the end of 2018 (Figure 6).

(Click to enlarge)
Figure 6. Figure showing U.S. oil stocks (crude plus oil products) together with the corresponding oil prices. Rough guess of how balance might disappear and future prices by author.
Of course, one of the big issues is that consumers cannot really afford high-priced oil products. If consumers could not afford $100+ prices back in 2013, how would it be possible for oil prices to rise to something like $97 per barrel by the end of 2018?
I am not certain that oil prices can really rise this high, or that they can stay at this level very long. Certainly, we cannot expect oil prices to rise to the level they did in July 2008, without recession causing oil prices to crash back down.
What the Economy Needs Is Rising Energy Per Capita
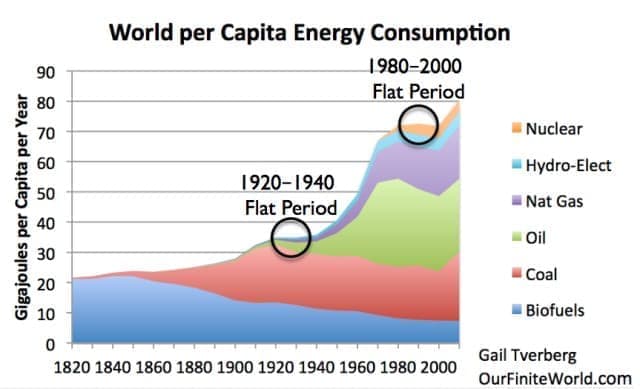
I have published energy per capita graphs in the past. Flat spots tend to represent problem periods.
(Click to enlarge)
Figure 7. World per Capita Energy Consumption with two circles relating to flat consumption. World Energy Consumption by Source, based on Vaclav Smil estimates from Energy Transitions: History, Requirements and Prospects (Appendix) together with BP Statistical Data for 1965 and subsequent, divided by population estimates by Angus Maddison.
The 1920-1940 flat period came shortly after the United Kingdom reached Peak Coal in 1913.

(Click to enlarge)
Figure 8. United Kingdom coal production since 1855, in figure by David Strahan. First published in New Scientist, 17 January 2008.
In fact, the UK invaded Mesopotamia (Iraq) in 1914, to protect its oil interests. The UK wasn’t stupid; it knew that if it didn’t have sufficient coal, it would need oil, instead.
There were many other disturbing events during this period, including World War I, the 1918 flu pandemic, the Great Depression, and World War II. If there are not enough energy resources to go around, many things tend to go wrong: countries tend to fight for available resources; jobs that pay well become less available; deflation becomes more likely; population becomes weakened, and epidemics become more likely. I wrote about the 1920 to 1940 period in a recent post, The Depression of the 1930s Was an Energy Crisis
The 1980-2000 flat period included the collapse of the Soviet Union, in 1991. The Soviet Union was an oil producer. The Soviet Union collapsed after prices had been low for a long time.

(Click to enlarge)
Figure 9. Former Soviet Union oil consumption, production, and inflation-adjusted price, all from BP Statistical Review of World Energy, 2015.
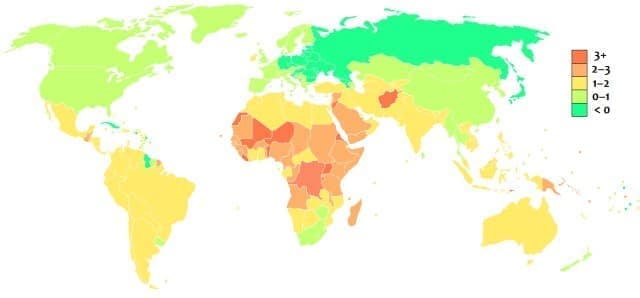
Even many years after the collapse of the Soviet Union, population growth in former Soviet Union countries and its affiliates was much lower than in the rest of the world.
(Click to enlarge)
Figure 10. World population growth rates between 2005 and 2010. Source: https://en.wikipedia.org/wiki/List_of_countries_by_population_growth_rate
Lower population (through falling birth rates, rising death rates, or rising emigration) are a major way that economies self-adjust because of falling energy per capita. Economies tend to fix the low-energy per capita problem by adjusting the population downward.
Recently, we have again been hitting flat periods in energy consumption per capita.

(Click to enlarge)
Figure 11. World per capita consumption of oil and of total energy, based on BP Statistical Review of World Energy data and UN 2017 population data.
Related: 3 Million Barrels Per Day Could Go Offline In 2018
The slowdown in world energy consumption per capita in 2008-2009 was clearly a major problem. Oil, coal and natural gas consumption fell simultaneously. Oil consumption per capita fell more than the overall mix, especially affecting countries heavily dependent on oil (Greece with its tourism, but also the U.S., Japan, and Europe).
The recent shift in political strategy to more isolationist stances also seems to be the result of flat energy consumption per capita. It is doubtful that Donald Trump would have been elected in the U.S., if world energy consumption per capita had been growing robustly, and if wage disparity had been less of a problem.
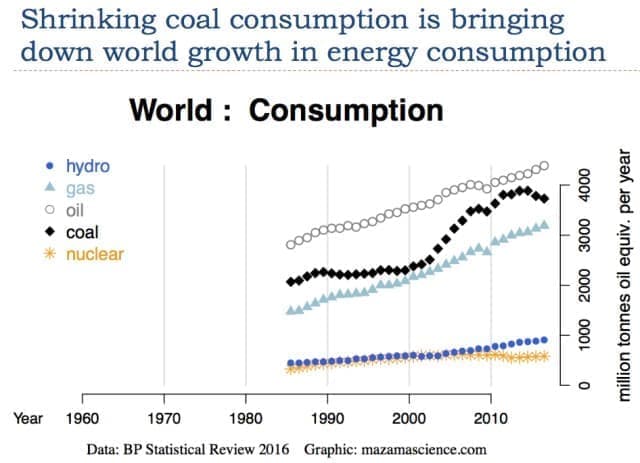
The primary cause of the 2013 to 2016 flat trend in world energy consumption per capita is (Figure 11) is falling coal consumption (Figure 12). Many people think coal is unimportant, but it is the world’s second largest source of energy, after oil. We don’t have a good way of getting natural gas production to rise enough, to make up for loss of coal production.
(Click to enlarge)
Figure 12
Wind and solar simply do not work for solving our problem of flat or shrinking energy consumption per capita. After spending trillions of dollars on them, they make up only a tiny (1 percent) share of world energy supply, according to the International Energy Agency. They are part of the little gray “Other” sliver on Figure 15.

(Click to enlarge)
Figure 13. Figure prepared by IEA showing Total Primary Energy Supply by type from this IEA document.
Something Has to “Give,” When There Is Not Enough Energy Consumption per Capita
The predicament we are facing is that energy consumption per capita seems to be reaching a maximum. This happens because of affordability issues. Over time, the price of energy products needs to rise to keep up with the rising cost of creating these energy products. But if energy prices do rise, workers earning low wages cannot to afford to buy goods and services made with high-priced energy products, plus honor all of their other commitments (such as mortgages, auto loans, and student loans). This leads to debt defaults, as it did in the 2008-2009 recession.
At some point, the affordability problem can be expected to hold down energy consumption. This could happen in many ways. Spiking prices and affordability issues could lead to a worse rerun of the 2008-2009 recession. Or if oil prices stay fairly low, oil-exporting countries (such as Venezuela) may collapse because of low prices. Even if oil prices do rise, we may find that higher prices do not lead to sufficient additional supply because investment in new oil fields has been low for many years, because of past low prices.
As long as the world economy is expanding (Figure 14), individual citizens can expect to benefit. Jobs that pay well are likely to be available, and citizens can afford to buy goods with their growing wages. People who sell shares of stock and people who get pension benefits can all receive part of this growing economic output.
(Click to enlarge)
Figure 14. Author’s image of an expanding economy.
Once the economy starts to shrink (Figure 15), we start having problems with dividing up the goods and services that are available. How much should retirees get? Governments? Today’s workers? Holders of shares of stocks and bonds? Not all commitments can be honored, simultaneously.

(Click to enlarge)
Figure 15. Author’s image of declining economy. If world population is rising at the same time, the per capita “shrinkage” problem gets to be worse.
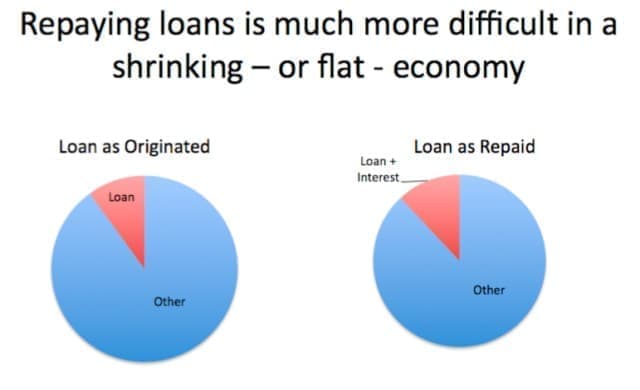
One obvious problem in a shrinking economy is that loans become harder to repay. The problem is that there is less left over for other goods and services, after debt plus interest is subtracted, in a shrinking economy.
(Click to enlarge)
Figure 16. Figure by author.
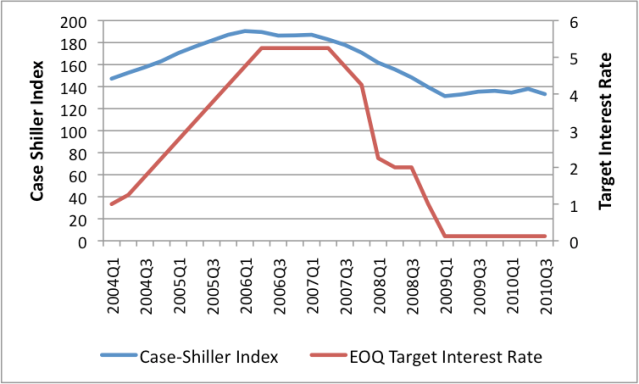
Changing interest rates can to some extent help offset problems related to higher energy prices and shrinking supply. The danger is that interest rates can move in the wrong direction and make our problems worse. In the lead-up to the Great Recession of 2008-2009, the U.S. raised short-term interest rates, helping to puncture the sub-prime mortgage debt bubble.

(Click to enlarge)
Figure 17. Figure comparing Case-Shiller Seasonally Adjusted Home Price Index and Federal Reserve End of Quarter Target Interest Rates. See Oil Supply Limits and the Continuing Financial Crisis for details.
We now hear a lot of talk about raising interest rates and selling QE securities (which would also tend to raise interest rates). If growth in energy consumption per capita is already flat, these changes could make the problems that the economy is facing even worse.
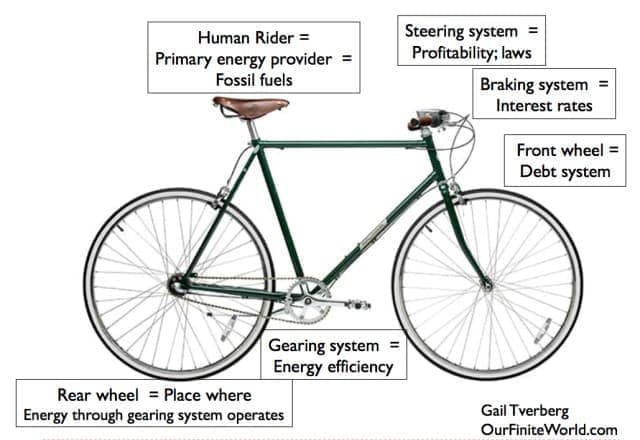
Our Economy Works Like a Bicycle
Have you ever wondered why a two-wheeled bicycle is able to stay upright? Research shows that a bicycle will stay upright, as long as its speed is greater than 2.3 meters (7.5 feet) per second. This is the result of the physics of the situation. A related academic article states, “This stability typically can occur at forward speeds v near to the square root of (gL), where g is gravity and L is a characteristic length (about 1 m for a modern bicycle).”
Thus, a bicycle will be able to continue in an upright manner, as long as it goes fast enough. If it slows down too much, it will fall down. Our economy is similar.
Gravity plays an important role in determining the speed of a bicycle. If the bicycle is going downhill, gravity gives an important boost to the speed of the bicycle. If the bicycle is going uphill, gravity very much pulls back on the bicycle.
I think of the situation of an economy having rising energy consumption per capita as being very much like riding on a bicycle, speeding down a hill. The person operating the bicycle would not need to provide much extra energy to keep the bicycle going.
If energy consumption per capita is flat, the person riding the bicycle must provide the energy to make it go fast enough, so it doesn’t fall over. This is somewhat of a problem. If energy consumption per capita actually falls, it is a true disaster. The bicyclist himself must provide the energy necessary to push the bicycle and rider uphill.
In fact, there are other ways that a speeding bicycle is analogous to the world economy.
(Click to enlarge)
Figure 18. Author’s view of analogies of speeding upright bicycle to speeding economy.
The economy needs a constant flow of outside energy. In the case of the bicycle, the human rider can provide the energy flow. In the case of the economy, the energy flow comes from a mixture of various fuel types, typically dominated by fossil fuels.
Growing debt (front wheel) is important as well. It tends to pull the economy along, because this debt can be used to pay wages and to buy materials to make create additional goods and services.
In fact, the financial system as a whole is important for the “steering” of the economy. It tells investors which investments are likely to be profitable.
The gearing system of the bicycle plays a modest role in the system. Changing gears allows greater efficiency in the use of the energy that is available, under certain circumstances. But energy efficiency, by itself, cannot operate the system.
If the human rider does not provide sufficient energy for the bicycle to go rapidly enough, the bicycle glides for a while, and then falls over. The world economy seems to be similar. If the world economy does not obtain enough energy per capita, economic growth tends to slow and eventually collapses. The collapse can relate to the whole world economy, or to parts of the economy.
The Problem of Parts of the Economy Not Getting Enough Energy
We can think of the economy as being made up of many bicycles, operated by bicycle riders. At the beginning of the post, I talked about the problem of wage disparity. This issue occurred at the time of the 1930’s Great Depression and is occurring again now.
We might call wage disparity “too low a return on the labor of some workers.” In groups of animals in ecosystems, too low a return on the effort of these animals is what causes ecosystems to collapse. For example, if fish have to swim too far to obtain additional food, their population will collapse. It should not be surprising that economies tend to collapse, when the return on the efforts of part of their workers falls too low.
Wage disparity has to do with how well the operators of bicycles are doing. Are the operators of these bicycles receiving enough calories, so that they can keep pumping their bicycles fast enough so that the speed is high enough to remain upright?
If energy consumption per capita is growing, this greatly helps the operation of the economic system. If there is growing availability of inexpensive energy, machines of various types, including trucks, can be used to increasingly leverage the labor of workers. This increased leveraging helps each worker to become more “productive.” This growing productivity, thanks to growing energy consumption, allows more goods and services to be produced in total. It also allows the wages of the workers to stay high enough that they can afford to buy a reasonable share of the output of the economy. When this happens, “gluts” of unaffordable goods are less of a problem.
If energy consumption per capita is flat (or worse yet, falling), greater “complexity” is needed, to keep output of goods and services rising. Greater complexity involves more specialization and more training of individual members of the economy. Greater complexity leads to larger companies, more government services, and more wage disparity. Unfortunately, there are diminishing returns to complexity, according to Joseph Tainter in “The Collapse of Complex Societies.” Ultimately, increased complexity fails to provide an adequate number of high-paying jobs. Wage disparity becomes a problem that can cause an economy to collapse.
If there is not enough economic output, the physics of the economy tries to “freeze out” workers at the bottom of the hierarchy. Workers with low wages cannot afford homes and families. The incidence of depression rises. Debt levels of disadvantaged groups (such as young people in the U.S.) may rise.

(Click to enlarge)
Figure 19. Source: Millennials Are Being Left Behind And It Poses A Huge Risk To The U.S.
So the situation may not be that the whole world economy fails; it may be that parts of the economy collapse. In fact, we are already seeing evidence that this is taking place. For example, life expectancies for U.S. men have been falling for two years, because of growing problems with drug overdoses.
Conclusions
In 2017, the world economy seemed to be gliding smoothly along because the economy has been able to get the benefit of artificially low energy prices and artificially low interest rates. These artificially low prices and interest rates have given a temporary boost to the world economy. Countries using large amounts of energy products, including the U.S., especially benefitted.
Related: Cold Snap Leads To Biggest U.S. Natural Gas Draw Ever
We cannot expect this temporary condition to continue, however. Low oil prices have already started to disappear, with Brent oil prices at nearly $69 per barrel at this writing. The trends in oil prices and oil stocks in Figure 8 are disturbing. If oil prices begin to rise toward the price needed by oil producers, they are likely to trigger a recession and a drop in world energy consumption, just as spiking prices did in 2008-2009. There is a significant chance of collapse in the next 12 to 24 months. It is hard to know how widespread such a collapse may be; it may primarily affect particular countries and population groups.
To make matters worse, our leaders do not seem to understand the situation. The world economy badly needs rising energy consumption per capita. Plans to raise interest rates and sell QE securities, when the economy is already “at the edge,” are playing with fire. If we are to keep the world economy operating, large quantities of additional energy supplies need to be found at very low cost. It is hard to be optimistic about this happening. High-cost energy supplies are worthless when it comes to operating the economy because they are unaffordable.
Many followers of the oil situation have had great faith in Energy Returned on Energy Invested (EROI) analysis telling us which kinds of energy supplies we should increase. Unfortunately, EROI doesn’t tell us enough. It doesn’t tell us if a particular product is scalable at reasonable cost. Wind and solar are great disappointments, when total costs, including the cost of mitigating intermittency on the grid, are considered. They do not appear to be solutions on any major scale.
Other researchers looking at the energy situation have not understood how “baked into the cake” the need for economic growth, rising per capita energy consumption, and rising debt levels really are. Rising debt is not an error in how the financial system is put together; a bicycle needs a front wheel, or it cannot operate at all (Figure 20). I have written other articles regarding why debt is needed to pull the economic system forward.
This economic growth cannot be “fake growth” either, where a debt Ponzi Scheme seems to allow purchases that real-life consumers cannot afford. Quite a bit of what is reported as world GDP today is of a very “iffy” nature. If China builds a huge number of apartments that citizens cannot afford without subsidies, should these be counted as true GDP growth? How about unneeded roads, built using the rising debt of the Japanese government? Or recycling performed around the world, because it makes people “feel good,” but really requires substantial subsidies?
At this point, it is hard for us to know where we really are, because every government wants to make GDP results look as favorable as possible. It is clear, however, that 2018 and 2019 can be expected to have more challenges than 2017. We have interesting times ahead!
By Gail Tverberg
More Top Reads From Oilprice.com:
- UAE Oil Minister: OPEC Deal Could Extend Beyond 2018
- Shale Restraint Could Lift Oil To $80
- $60 Oil Will Not Last Long


With a re-balancing in the global oil market almost reaching its completion now, I doubt an oil surplus could recur so soon particularly that the fundamentals of the global oil market are very positive and OPEC members have learned a very costly lesson not to produce above their production quotas.
Oil prices are heading towards $70/barrel or higher in 2018 and $100 or higher in 2020.
However, a fair price for oil, in my opinion, is $100-$130/barrel. Such a price provides enough revenue to oil-producing countries thus enabling them to invest in oil exploration and production capacity expansion so as to meet global demand in coming years. It enhances global investments. It also enables the global oil industry to balance its books and invest in new projects.
While it is true that low oil prices could reduce the cost of manufacturing, thus helping the global economy to grow, it is a short-term benefit as this is vastly offset by a curtailment of global investment which forces companies around the world to cut spending, sell assets and make thousands, if not millions, of people redundant.
Dr Mamdouh G Salameh
International Oil Economist
Visiting Professor of Energy Economics at ESCP Europe Business School, London
Conclusion: Worthless article
The long period of artificially high prices did what it artificially high prices always do. It incented massive new technologies and production, especially with sale oil and gas in the USA, that lowered the price of producing a barrel of shale oil beyond what anybody thought was possible, and allowing it to be brought to market faster than anybody thought was possible. Suddenly we had a glut of oil & gas on the market, and prices responded to the glut of oil and gas. To call that natural response to a huge lowering of production cost and increase in supply artificial is laughable.
Today WTI is trading close to $65, and why? There is still a glut of oil on the market even with OPEC/Russia idling millions of barrels of production a day. Meanwhile U.S. shale oil and gas has production cost around $40 a barrel, and prices at $50 and now $65 have production booming. The USA is hitting record production and there is no end in sight, unless of course, as many are talking about U.S. companies restrain production artificially to keep prices high, even as OPED/RUSSIA keep millions of barrels of oil production idle.
Prices at $30 were not artificially low. They were caused by a huge glut of oil on the market, a glut that has diminished but not disappeared despite the year long efforts of OPEC/RUSSIA to restrict production and artificially keep the price of oil higher. The only way to keep prices at $65 a barrel, or even over $50 a barrel for WTI is if the entire industry including U.S. producers conspire to artificially keep prices high by colluding to restrict production.
As to the entire issue of wage disparity? It is true that in the USA wage disparity grew under the Marxist/Socialist job killing, growth killing policies of the Obama/Democrat regime that gave the USA 8 years of utter misery. However, we are already seeing jobs and wages rising, and most recently $1000 bonuses and pay increases for tens of millions of middle class Americans who are also about to see more money in their pay checks from tax cuts.
Now of course Governments and corrupt cartels like OPEC/RUSSIA can conspire to continue to increase the price of oil, but only if U.S. companies illegally join their cartels. And the Marxist/Socialist Democrats could increase their political power by winning control of Congress in 2018, in which case we'd face stalemate and return to the misery and decline of the Obama years. Yes...that can all happen, but only if we let it happen. If we don't allow illegal collusion in the oil & gas industry from U.S. companies supply will increase to the point OPEC/RUSSIA can't artificially keep prices above $50 a barrel, and if the country rejects the job killing, Marxist, America Hating democrats the economy will continue to boom.