Maybe it’s just me, but natural gas futures seem to have been very hard to read and predict lately. Unusual weather patterns have caused some volatility in storage numbers, but no move seems able to gain any momentum. It has been the classic “choppy” market for a while, but that may be about to change if a widely followed technical signal is anything to go by.
That signal is the pattern formed when a short-term moving average crosses over the long-term. If it does so with the short-term line moving upwards, it is generally considered a bullish indicator and is called a “golden cross”. When the short-term is moving downwards, it is known as a “death cross” and is seen as bearish.
Of course, as with all technical indicators, there is one potential problem. The pattern that you see, or don’t see for that matter, depends on what you set as “short-term” and “long-term”. As is also true of all technical analysis though, the main value of these crosses is that if a lot of people see them and pay attention, they become a kind of self-fulfilling prophecy as traders position themselves for the expected move. For that reason, it is best to use simple, widely viewed parameters. For swing trading, that means looking at the 50 and 100-day simple moving averages. They are marked by yellow and blue lines respectively on this chart…
As you can see, the crossover came at the start of this week. It was followed by a down day, but not enough to immediately reverse the…
Maybe it’s just me, but natural gas futures seem to have been very hard to read and predict lately. Unusual weather patterns have caused some volatility in storage numbers, but no move seems able to gain any momentum. It has been the classic “choppy” market for a while, but that may be about to change if a widely followed technical signal is anything to go by.
That signal is the pattern formed when a short-term moving average crosses over the long-term. If it does so with the short-term line moving upwards, it is generally considered a bullish indicator and is called a “golden cross”. When the short-term is moving downwards, it is known as a “death cross” and is seen as bearish.
Of course, as with all technical indicators, there is one potential problem. The pattern that you see, or don’t see for that matter, depends on what you set as “short-term” and “long-term”. As is also true of all technical analysis though, the main value of these crosses is that if a lot of people see them and pay attention, they become a kind of self-fulfilling prophecy as traders position themselves for the expected move. For that reason, it is best to use simple, widely viewed parameters. For swing trading, that means looking at the 50 and 100-day simple moving averages. They are marked by yellow and blue lines respectively on this chart…

As you can see, the crossover came at the start of this week. It was followed by a down day, but not enough to immediately reverse the signal, then a couple of positive days have gotten us back to around the same level. If we push just a little higher from here and the market consolidates above the current 100-day moving average at 2.3260 it will be another confirmation of a bullish trend.
The setup is clear and confirmed in a couple of ways, but that doesn’t mean that a move up is guaranteed. Technical analysis is great and, as I said, especially useful when it is something like this, a simple signal that is followed by a lot of traders, but it is always trumped by fundamental supply and demand conditions.
On that front, the unusual weather patterns that have made NG so hard to read lately could actually work in favor of a long position. Most people are aware now that climate change, while it has the long-term effect of raising global average temperatures overall, often leads to extremes in both directions. The fact that such an important part of natural gas demand in the U.S. comes from its use as a fuel for power plants means that any extreme, hot or cold, increases demand.
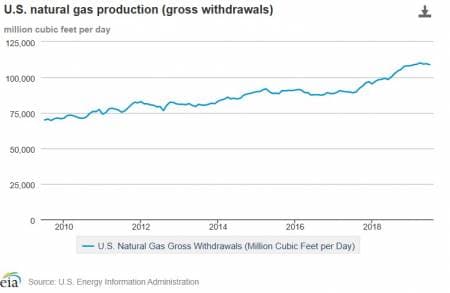
Cold snaps have caused a couple of spikes in natural gas over the last few years as a result, but even if we don’t get a major freeze, the chance of it will provide support to the market over the next couple of months. Add in the fact that EIA numbers show U.S. natural gas production leveling out and even falling slightly after a sustained run-up (see chart below), and the fundamental picture also looks supportive.

Even when technical and fundamental conditions both point in the same direction though, you should always accept that a trade can go wrong and be prepared for it should it happen. That means setting a stop loss, and in this case, the low of a week ago at 2.1870 is a good starting point for that.
As for the upside to the trade, this is designed to be run for a while, and when that is true, target prices are essentially levels at which to reexamine the market, rethink, and reset stops rather than cut completely. The first of those here would be around 2.40. If we get there, the consolidation above the average would be confirmed, allowing for the stop to be moved to just below it.
A golden cross is a powerful signal, but even so, without the support of the fundamental outlook, it would probably be best ignored in a choppy market like NG. With that support though, long NG looks like a trade worth taking at these levels.


