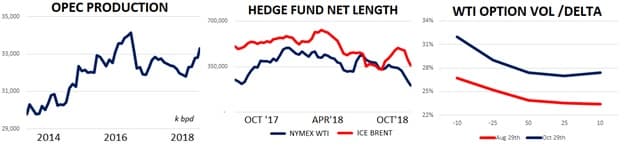
Last week’s Commitment of Traders report showed yet another round of massive selling of ICE Brent and NYMEX WTI contracts by hedge funds. NYMEX WTI net length fell from 240k contracts to 206k contracts (-14% w/w) while ICE Brent net length held by funds decreased from 409k contracts to 361k (-12%.) On a combined basis net length between the two contracts stands at its lowest mark in 14 months and gross short positions held by funds have more than doubled in the last four weeks.
At first glance this seems like a highly bearish set of circumstances for oil, right? The world’s speculators- many of them energy experts- seem aggressively bearish on crude. A closer look, however, reminds us that the pros don’t always get it right and that a bearish flush of headlines can frequently clear the way for the next move higher in prices. For example, gross short positions in NYMEX WTI (meaning the total amount of bearish positions held by funds) currently stand at 64k contracts. The last time this measure exceeded 50k contracts was back in July, just in time for oil to rally from $70 to $86 over the next two months. In 2017 gross shorts reached a 5yr high 180k contracts which perfectly coincided with a 2yr low in prices at $58. Even more notable was a 6yr low in hedge fund net length in January of 2016 which preceded oil’s rally from $26/bbl to $52 over the coming 5-month period. Going back just one more year to 2015 funds liquidated their net length by 30% in February and March…
Last week’s Commitment of Traders report showed yet another round of massive selling of ICE Brent and NYMEX WTI contracts by hedge funds. NYMEX WTI net length fell from 240k contracts to 206k contracts (-14% w/w) while ICE Brent net length held by funds decreased from 409k contracts to 361k (-12%.) On a combined basis net length between the two contracts stands at its lowest mark in 14 months and gross short positions held by funds have more than doubled in the last four weeks.
At first glance this seems like a highly bearish set of circumstances for oil, right? The world’s speculators- many of them energy experts- seem aggressively bearish on crude. A closer look, however, reminds us that the pros don’t always get it right and that a bearish flush of headlines can frequently clear the way for the next move higher in prices. For example, gross short positions in NYMEX WTI (meaning the total amount of bearish positions held by funds) currently stand at 64k contracts. The last time this measure exceeded 50k contracts was back in July, just in time for oil to rally from $70 to $86 over the next two months. In 2017 gross shorts reached a 5yr high 180k contracts which perfectly coincided with a 2yr low in prices at $58. Even more notable was a 6yr low in hedge fund net length in January of 2016 which preceded oil’s rally from $26/bbl to $52 over the coming 5-month period. Going back just one more year to 2015 funds liquidated their net length by 30% in February and March only to watch WTI run from $43 on March 16th to $61 by May 6th. This data serves as a valuable reminder that the speculative herd doesn’t always get things right. Selling often begets selling as buying begets buying and at a certain point profit-taking and position covering can drive sharp u-turns in the market. There are certainly bearish challenges ahead for oil, but we don’t view the negative position held by hedge funds as a damning piece information for bulls.
Moving on from fund positioning, this week capped a fourth straight week of selling for oil prices as WTI sank to $63 and Brent fell to $73. Both contracts are lower by about $13 over the last four weeks as increased production, weakening demand forecasts for 2019 and aggressive selling in global stock markets have led the bearish move.
On the macro side the US and China continue to slap tariffs on goods heading into a Trump/Xi meeting which will be critical in setting the economic tone for the coming year. This week BlackRock CEO Larry Fink stated in an interview that “I do believe if the path remains the same in the next few weeks, we’re going to have a full-fledged trade war.” That assessment certainly won’t inspire anyone who’s concerned about crude oil demand in 2019. On a more positive note, there was a modest relief rally in global equities this week with earnings forecasts remaining largely positive.
Fundamentals also continued to surprise to the bearish side with OPEC producing more than expected In October while US crude oil inventories increased for a sixth straight week. Bullish risks including decreased Iranian barrels, MENA geopolitics and a lack of spare capacity persist, but one of them will have to shift from being a risk to a reality if oil is going to get its bullish mojo back anytime in 2018.

(Click to enlarge)
Quick Hits
- Crude prices continued to slide lower this week making for their worst monthly losses since 2016. Heightened output from the US, Russia and OPEC (in spite of Iranian sanctions,) concerns related to demand growth in 2019 and a rout of global equities have driven the market weakness.
- OPEC production estimates for October are rolling in and the results look impressively bearish. Reuters’ early survey saw the cartels production at 33.3m bpd on the month for a 390k bpd gain from September. The UAE registered the largest gain in the pack of 200k bpd to 3.25m bpd while Libya jumped by 170k bpd to 1.2m bpd. Saudi supplies jumped modestly to 10.65m bpd. Iranian supplies were also surprisingly high at 3.4m bpd.
- Increased OPEC barrels have helped drive hedge fund net length in ICE Brent and NYMEX WTI (combined) to its most bearish mark since August ‘17
- As for demand concerns, Bloomberg offered a new report this week suggesting that Chinese gasoline demand growth will slip to 2% in 2018 and towards 1% by 2020 due to surging electric vehicle sales and new mandates requiring 10% ethanol blending at the pump.
- Crude oil options show continued fear of downside risk in the market as traders have been eager to buy put options while call options remain unfashionable. As of this week, WTI option implied volatility was for at-the-money strikes priced at 27%, while 25 delta puts traded at 29% and 25 delta calls traded at 27%. Put premiums were even stronger on 10 delta ‘wingy options’ where puts traded 5-vols over calls. The big takeaway here is there just isn’t much fear of an upside move with respect to portfolio insurance for oil traders.
- Away from oil markets there was a recovery in stock prices this week after three weeks of massive selling. S&Ps jumped back above the 2,700 mark and government bonds broadly sold off as the flight to safety trade softened.
- The US dollar index jumped to its highest mark since June ’17 this week adding yet another bearish input into the crude oil mix. Higher bond yields and strong GDP data were two of the main drivers of the demand for US Dollars in recent trading sessions.
(Click to enlarge)
DOE ROUNDUP
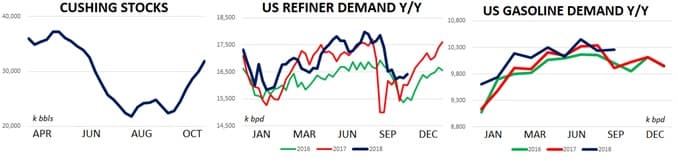
- US crude inventories added 3.2m bbls w/w and are lower y/y by about 7%
- Cushing stocks also jumped to a 4-month high at 32m bbls
- On a more positive note, US refiner demand and gasoline demand look strong
US crude oil inventories jumped for a sixth straight week and continue to dampen potential strength in the market. Stocks continue to jump in PADD II, PADD III and Cushing where ballooning inventories are putting bearish pressure on WTI spreads. Much of the inventory builds is due to massive US production which reached a new record of 11.2m bpd and is higher by an incredible 1.7m bpd y/y. On a more positive note, US gasoline and distillate supplies fell by about 6m bbls this week combined. US distillate stocks are flat y/y while gasoline stocks are +3% y/y
(Click to enlarge)
Demand data looks comparatively bullish to the supply side of the balance sheet right now and is showing strong y/y growth. US refiners processed 16.4m bpd last week which is higher y/y by about 400k bpd. On the retail level, domestic gasoline consumption + exports are higher by about 200k bpd y/y after printing north of 10.25m bpd last week.