


The near WTI futures price is down 23 percent since peaking on October 3rd as traders front ran the Iranian oil sanctions, which went in to place this week. Fearing spiking oil prices, the U.S. granted waivers to eight of Iran’s largest buyers of crude – China, India, South Korea, Japan, Italy, Greece, Taiwan, and Turkey.
KeyStone Cops Markets
Now fearing the world is amply supplied, traders are selling crude down and down. The U.S. now produces more oil than Saudi Arabia and Russia.
The United States has increased output to more than 11 million barrels a day, surpassing Saudi and Russian production. Saudi Arabia and Russia have also been increasing output to offset the drop in Iranian exports. – CNBC
Testing Key Levels
After bottoming below $42 on June 1, 2017, WTI’s 2-year uptrend has been violated and now testing critical Fibonacci retracement levels. It has already sliced through the .382 at $63.32 and is now set to test the .500 at $59.12. The next key level is the .618 at around $55, which, if broken, it significantly increases the risk of giving it all back.
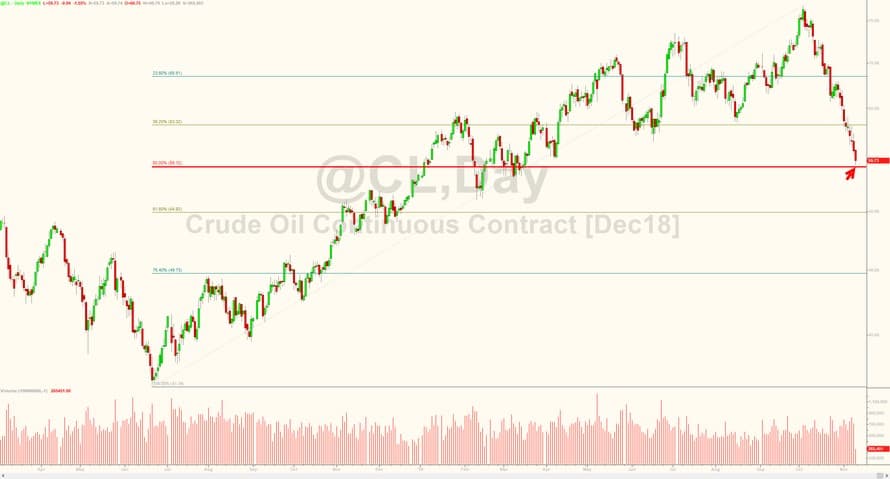
(Click to enlarge)
Crude prices are a trending machine and usually need a significant fundamental change, such an OPEC cut, to reverse the trend. We urge caution. Watch and wait mode, folks.
Crude Oil And The S&P
Not exactly a perfect correlation, but the chart illustrates both stocks and the oil price tend to move together. Moreover, such a large price divergence as seen over the past month is not sustained. We suspect crude is sending a signal that stocks are going to, at best, struggle here or move lower.

(Click to enlarge)
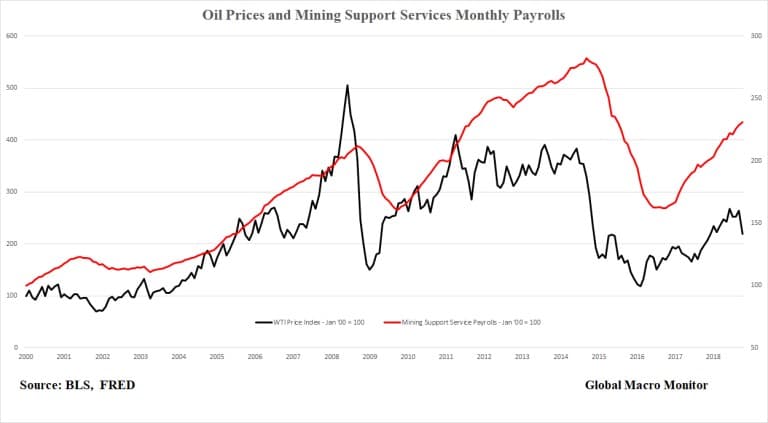
Crude Prices And U.S. Jobs
We have written quite a bit about the U.S. labor market over the past year.
The only sector, which has experienced outsized employment growth since January 2017 has been in mining with job growth over 17 percent since President Trump took office. The rise in the oil price has generated demand for roughneck hiring in the oil patch.

(Click to enlarge)
The following chart illustrates how mining support service hiring tracks the oil price but with a lag, from anywhere between 2-8 months.
(Click to enlarge)
If past is prologue, the downturn in prices won’t begin to be felt in the oil patch for another month or two.
By Zerohedge
More Top Reads From Oilprice.com:
- This High Profile Merger Could Impact EU Gas Markets
- What’s Behind The Continued Selloff In Oil?
- U.S. Oil To Significantly Outperform This Year


