


The United States is no longer over-supplied with oil. That sounds like good news. The bad news is that it may signal lower oil prices going forward.
An unexpected 9 million barrel (mmb) crude oil withdrawal from storage this week moved comparative inventory (C.I.) below the 5-year average. That shifted C.I. to into negative territory at -5 mmb for the first time since September 2018.
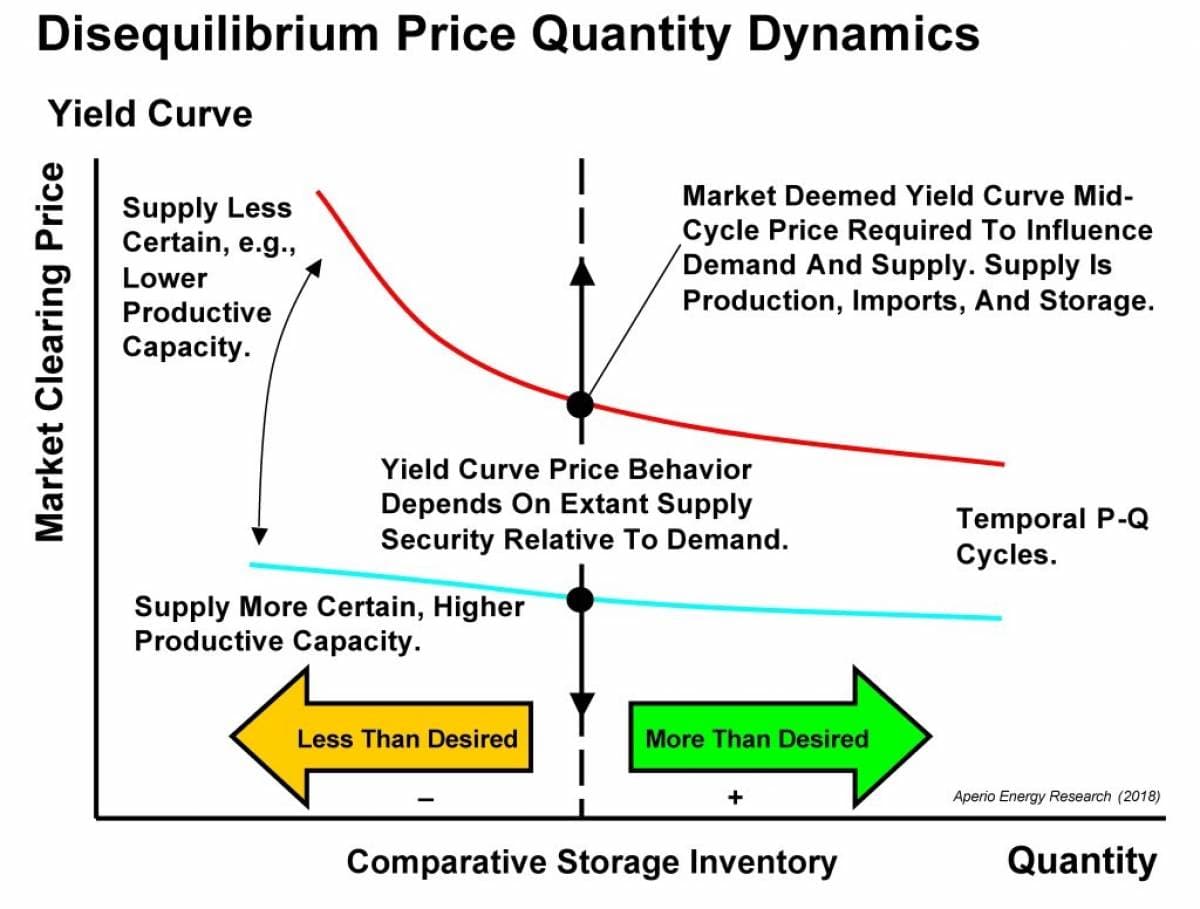
The bad news is that it crossed the 5-year average at about $55/ barrel. That crossing point is called the mid-cycle price, the clearing price of the marginal barrel needed to maintain adequate supply through the current supply-demand cycle (Figure 1).
(Click to enlarge)
Figure 1. Comparative inventory road map. Mid-cycle price is the clearing price of the marginal barrel needed to maintain adequate supply through the current supply-demand cycle. Source: Aperio Energy Research
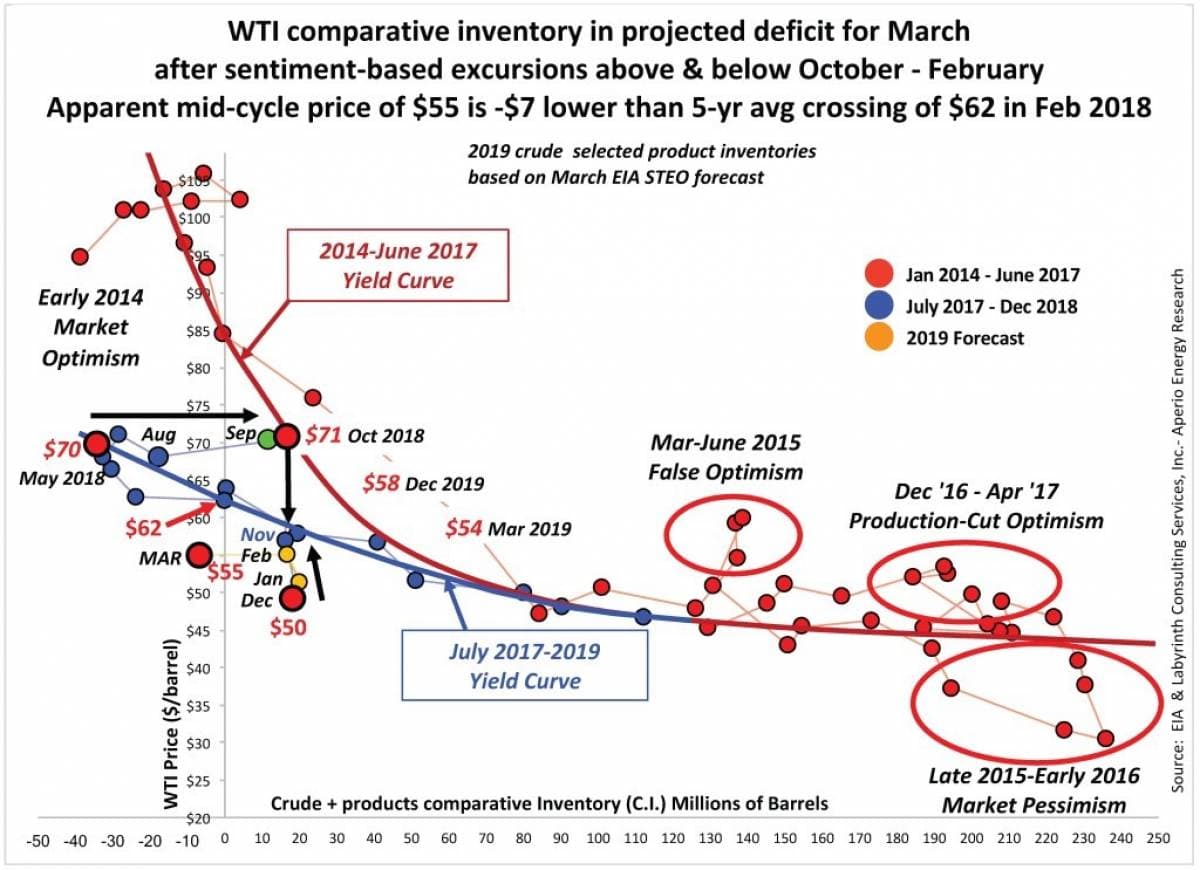
Figure 2 shows the real-world comparative inventory-WTI price cross-plot for 2014 through the present. C.I. reached a minimum in May 2018 (red dot on far left of figure) after progressing along the July 2017-2019 yield curve (blue).
(Click to enlarge)
Figure 2. WTI comparative inventory is in projected deficit for March. Source: EIA and Labyrinth Consulting Services, Inc. – Aperio Energy Research
C.I. increased along the black arrow at ~$70 prices through October 2018 (second red dot). These prices were inflated above the yield curve by market sentiment about the effect of U.S. sanctions on Iran for oil supply. Related: One Last Warning For The U.S. Shale Patch
Once those fears were relieved, price moved downward along the next black arrow to the December monthly average price of $50. This move was in response to growing market sentiment that the world was over-supplied with oil.
Since December, prices increased back toward the yield curve along the third black arrow through February. Large inventory withdrawals over the last two weeks have moved the projected March C.I. vs price data point to the left of the y-axis, the C.I. 5-year average.
That crossing point or mid-cycle price was approximately $55/barrel which is about $7 lower than the previous $62 mid-cycle crossing point in March 2018. More data is needed to fully evaluate the stability of this C.I.-price trend and its implications for oil prices going forward.
Many analysts and market observers believe that oil prices will move much higher with OPEC+ production cuts, declining U.S. inventories and a relatively strong global economy assuming that U.S.-China trade talks have a happy ending. I agree with them but C.I. yield curve data suggests that prices may disappoint the oil bulls.
The slope of the July 2017 through 2019 yield curve is flatter than the previous 2014 through June 2017 curve. That indicates that markets feel less urgency about future supply and that price response to falling C.I. will be somewhat subdued. The latest data suggests that the trend may be even flatter and lower than previously imagined.
I have no doubt that WTI prices will move higher in coming weeks and possibly months. It is reasonable that sentiment may take prices back to the $70 range. Sentiment-based price excursions are part of the C.I. model.
When WTI prices were in the $70s last September and October, I angered price bulls by suggesting that trend would probably not last. I am again urging caution based on the data.
By Art Berman for Oilprice.com
More Top Reads From Oilprice.com:
- U.S. ‘’Oil Weapon’’ Could Change Geopolitics Forever
- Trump’s Last Chance To Subdue Gasoline Prices
- Oil Prices Shoot Up On Large Inventory Draw


