


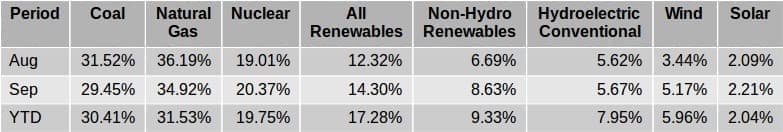
The EIA released the latest edition of their Electric Power Monthly on December 1st, with data for September 2017. The table above shows the percentage contribution of the main fuel sources to two decimal places for the last two months and the year to date.

(Click to enlarge)
According to the Electricity Monthly Update at the EIA web site:
Net generation in the United States decreased by 4.9 percent compared to September 2016, in part because the country experienced a cooler September in 2017 than it did the previous year.
Nuclear generated 4311 Gwh (6 percent) less than it did in August but, the decrease in the total generation meant its percentage contribution increased to 20.37 percent from 19.01 percent in August. A decrease in the absolute contribution from Solar from 7632 to 7384 GWh, translated to the percentage contribution actually increasing slightly to 2.21 percent, up from 2.09 percent in August. It is worthy of note that the percentage contribution from solar was below 2 percent in January and February only and continues to be on target to end the year with a contribution of slightly more than 2 percent, in line with the increase in capacity seen over the last twelve months.
The gap between the contribution from All Renewables and Nuclear narrowed slightly as All Renewables increased to 14.30 percent as opposed to Nuclear’s 20.37 percent contribution. The amount of electricity generated by Wind increased, resulting in the percentage contribution increasing by 1.73 percent. The contribution from Hydro continued to decline in absolute terms but the decrease in total generation meant that the percentage contribution remained essentially flat. Related: Oil Price Boom Keeps Lid On Natural Gas Prices
The combined contribution from Wind and Solar increased to 7.38 percent from 5.53 percent in August and the contribution from Non-Hydro Renewables also increased to 8.63 percent from 6.69 percent. The contribution of zero emission and carbon neutral sources, that is, nuclear, hydro, wind, solar, geothermal, landfill gas and other biomass increased to 34.67 percent from 31.33 percent in August.
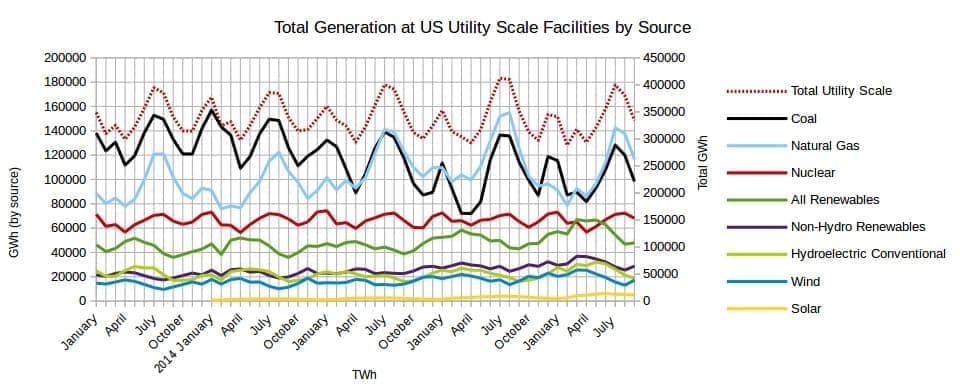
The graph below helps to illustrate how the changes in absolute production affect the percentage contribution from the various sources.
(Click to enlarge)
The graph below shows the total monthly generation at utility scale facilities by year versus the contribution from solar. The left hand scale is for the total generation, while the right hand scale is for solar output and has been deliberately set to exaggerate the solar output as a means of assessing its potential to make a meaningful contribution to the midsummer peak. This September the output from solar declined as is customary approaching the autumnal equinox and it can expected to continue to decline heading into the winter solstice. However, with solar capacity growing rapidly it can be expected to generate significantly more over the approaching winter season than was generated last winter, repeating the pattern of the past few years.

(Click to enlarge)
The graph below shows the monthly capacity additions for 2017 to date. In September 11.3 percent of capacity additions were Natural Gas. Solar added 39.4 percent and Wind contributed 49.3 percent of new capacity. In September the total capacity added was 505 MW only slightly higher than the lowest monthly figure for the year so far, 492 MW added in August.

(Click to enlarge)
Subsequent to the preparation of the initial draft of this report, it was reported by PV Magazine, among other sources that the EIA has reported a 47 percent increase in the amount of electricity generated by solar between the period of January to September 2016 and the corresponding period for this year. EIA: US solar output increases 47 percent in 2017
Related: $40 WTI Is Now More Realistic Than $60
In market segment terms, utility scale growth was twice as high, increasing 58 percent from 2016 to 2017, as small scale at 29 percent. The residential sector increased by 32 percent year-over-year, while the smaller sectors, commercial and industrial each grew 23 percent. Overall, PV continues its climb of market share of total electricity generated, going from 1.3 percent from January through September 2016 to 1.9 percent in the same time period in 2017.
This is not too far off the 2.04 percent shown in the table at the top of this report.
By Dennis Coyne via Peak Oil Barrel
More Top Reads From Oilprice.com:
- U.S. Oil Rig Count Dips, Ending 5 Week Streak
- IEA Dashes Bullish Sentiment In Oil
- Russia, China Grow Closer As The New Silk Road Unfolds


