Oil traders saw a mixed bag this week with Brent prices treading water near the $60 mark on a mix of bearish and bullish signals. Prices have retained their 20% bounce off their low point three weeks ago but have only retraced 29% of their massive selloff in the fourth quarter,
For news flow, central banks continued to inject bullish risk into the market via the People’s Bank of China which cut their reserve requirement for commercial banks and commented that they would step up lending efforts to small and medium businesses who may be hurt by the US trade slowdown. The Chinese government is also in the process of processing tax cuts for individuals and businesses to further juice economic activity. In the US, Kansas City Fed President and consistent tight money hawk Esther George gave prepared marks and surprisingly urged her fellow FOMC voters to hesitate before enacting further rate hikes in 2019. The US 10yr yield was trading near 2.70% this week which was basically unchanged. The US Dollar Index strengthened slightly following a disastrous Brexit vote for Theresa May which saw Parliament reject her proposal by a margin of 432-202.
In geopolitics, the most important item to note this week was the continued slowdown of Iranian exports as Washington reduces waivers for key customers. Bloomberg reported that Iranian exports are currently running near 1m bpd for a drastic decline from 2.7m bpd just six months ago. Our assumption is that this effort will eat into…
Oil traders saw a mixed bag this week with Brent prices treading water near the $60 mark on a mix of bearish and bullish signals. Prices have retained their 20% bounce off their low point three weeks ago but have only retraced 29% of their massive selloff in the fourth quarter,
For news flow, central banks continued to inject bullish risk into the market via the People’s Bank of China which cut their reserve requirement for commercial banks and commented that they would step up lending efforts to small and medium businesses who may be hurt by the US trade slowdown. The Chinese government is also in the process of processing tax cuts for individuals and businesses to further juice economic activity. In the US, Kansas City Fed President and consistent tight money hawk Esther George gave prepared marks and surprisingly urged her fellow FOMC voters to hesitate before enacting further rate hikes in 2019. The US 10yr yield was trading near 2.70% this week which was basically unchanged. The US Dollar Index strengthened slightly following a disastrous Brexit vote for Theresa May which saw Parliament reject her proposal by a margin of 432-202.
In geopolitics, the most important item to note this week was the continued slowdown of Iranian exports as Washington reduces waivers for key customers. Bloomberg reported that Iranian exports are currently running near 1m bpd for a drastic decline from 2.7m bpd just six months ago. Our assumption is that this effort will eat into US stockpiles in the near term- even though the US does not buy Iranian crude- as global markets tighten.
In terms of sentiment, it appears to us that oil markets are in a holding pattern following a tumultuous selloff and partial retracement. We’re noticing more and more sell-side researchers, bank analysts and government agencies offering a green light to oil’s prospects for 2019 with a plurality of forecasts calling for $65-$70 Brent. Even this author penned a note last week which could be described as a tiny bit bullish. Given the flood of semi-positive commentary in the market we thought it was important to highlight some market mood indicators which are flashing yellow as opposed to green.
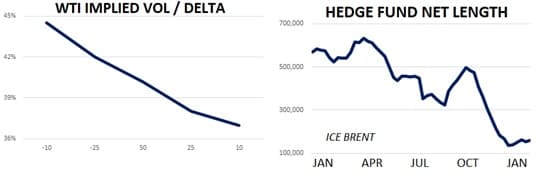
The first place we see caution among market participants is positioning from hedge funds. The last round of COT data showed speculators holding a net long position in ICE Brent of 158k contracts which is its lowest level in about three years. ICE Gasoil net length held by speculators stands at 7k contracts which is its lowest level in about 18 months. Neither one of these measures reveals bullishness among those who get make their living betting on prices.
Options markets show a similar trend via their ‘skew.’ For WTI options, 25 delta puts expiring in four months currently imply 42% volatility while 25 delta call options are pricing at 38% implied vol. This 4-vol difference shows a dramatic preference in demand from trading groups, banks and speculators for downside risk as opposed to upside risk and suggests traders are more concerned about the economic slowdown and increased US supplies than they are of OPEC+ production cuts and Iranian sanctions.
Lastly, oil’s time curve shows trepidation among physical traders of placing bullish bets. In Brent, the dated physical swap continues to trade at an 85-cent discount to the prompt Brent futures contract in a sign that demand for physical markers is soft. In the US, the prompt 6-month spread is offering 13-cents of contango per month and while overseas the prompt 6-month Brent spread is flat. All these markets are trending in a bullish direction, but for now, it’s impossible to say that any of them reveal strong bullish confidence in the market.
Given the amount of ‘positive vibes’ market commentators seem to be offering so far in 2019 we think it's important to remember that bearish risks persist.
We continue to have an ever so slightly bullish view of oil at current levels, but we’ll continue to watch hedge fund positioning, options markets and time spreads for hints on the mood of the market. For now, they seem to be telling us to proceed with caution.

(Click to enlarge)
(Click to enlarge)
Quick Hits
- Oil prices have been flat this week with Brent trading near $60/bbl while WTI traded $52/bbl. A small bullish jolt could push oil above its 50-day moving average for the first time since October.
- Global stock markets could pose a large bearish risk to crude oil yet again with US/China trade woes and Brexit on top of mind for traders. This week the S&P 500 was flat near 2,600, the Shanghai Composite was flat near 2,500 and the Euro Stoxx 50 was flat near 3,000.
- Interest rates also trended largely sideways. The US 10yr yield was near 2.70%.
- Economic numbers were highlighted by Chinese’ trade data which sent shivers through markets showing a 4.4% y/y contracts in exports and a 7.6% y/y contraction in imports.
- On a more bullish note, Chinese crude oil imports showed 10% y/y growth in December.
- WTI-Brent differentials continue to point to improving US fundamentals relative to overseas markets. The arb traded near $8/bbl this week (Brent premium and has tightened by $2/bbl over the last two months.
- Crude oil options continue to price at levels which reveal a large amount of downside concern among traders. 50 delta options are implied 40% volatility this week while 25 delta calls priced at 38% and 25 delta puts priced at 42%. The 4-vol premium for 25 delta puts v. 25 delta calls suggests that speculators and trade groups are still eager to own downside risk and comfortably with selling upside risk.
- Hedge funds continue to hold still with a largely bearish position. Net length in ICE Brent was basically flat w/w at 158k contracts which is 70% below its level from just four months ago and 68% below its 5yr average. Gross short positions in ICE Brent stand at 99k contracts which is higher by about 300% since October.
- Bearish positioning is even more drastic for hedge funds in gasoil contracts where net length stands at just 7k contracts- lower by 95% since October.
DOE WRAP UP
- US crude stocks fell by more than 1m bbls last week to 440m bbls and are higher y/y by about 5%.
- Unfortunately for bulls, stocks in the Cushing, OK trading hub continue to rise. Cushing stocks jumped by about 300k bbls last week to 42.25m bbls last week which is their highest market since January 2018.
- The US currently has 25.1 days of crude oil supply on hand which is lower by 1.9 days in the last two months and 1.4 days below its 5yr average. Our expectation is this measure could continue to tighten as OPEC+ cuts take hold while US refiner demand continues to grow.
- US crude oil traders exported 2.1m bpd of crude last week which was their lowest effort in two months.
- US crude oil imports jumped by more than 400k bpd to 7.8m bpd for their highest level in two months.
- Refiner demand fell by about 100k bpd last week to 17.6m bpd. The print represents a record-high on a seasonal basis showing y/y growth of about 250k bpd.
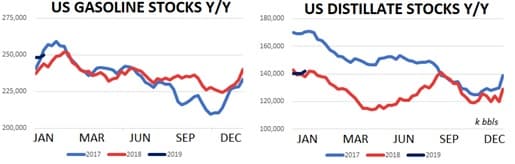
- US gasoline stocks jumped by about 8m bbls w/w to 248m bbls and are higher y/ by about 6%. PADD 1B gasoline stocks stand near 32m bbls which is slightly higher y/y.
- US gasoline demand dropped sharply last week with domestic demand + exports falling to 9.5m bpd- its lowest print in ten months. Total demand is lower y/y by about 100k bpd.
- US distillate stocks jumped by about 11m bbls last week to 140m bbls and are roughly flat y/y.
- As for demand, US distillate consumption + exports printed 4.3m bpd which was unchanged w/w and flat y/y
(Click to enlarge)
(Click to enlarge)