Friday June 1, 2018
In the latest edition of the Numbers Report, we’ll take a look at some of the most interesting figures put out this week in the energy sector. Each week we’ll dig into some data and provide a bit of explanation on what drives the numbers.
Let’s take a look.
Key Takeaways
- U.S. oil production has hit 10.769 million barrels per day, yet another record. After only marginal gains in the last few weeks, the strong 44,000 bpd weekly increase eased concerns that infrastructure bottlenecks were restraining production growth.
- Still, bottlenecks are a concern, resulting in a wider WTI discount this week.
- WTI weakness, however, led to a large increase in U.S. crude oil exports.
- The crude stock draw was larger than expected, but it didn’t do much to rescue oil prices.
1. Inventories back to average
(Click to enlarge)
- The oil market is tighter than at any point in the last few years. The metric that most analysts (and OPEC) have been watching is the level of oil inventories relative to the five-year running average.
- Inventory levels exploded during the downturn, with OECD stocks surpassing 3 billion barrels. That coincided with a period in which oil prices plunged below $30 per barrel.
- The OPEC cuts helped drain inventories. Since the beginning of 2017 when the deal began, OECD stocks have declined by 234 million barrels through April 2018. The U.S., specifically, saw inventories…
Friday June 1, 2018
In the latest edition of the Numbers Report, we’ll take a look at some of the most interesting figures put out this week in the energy sector. Each week we’ll dig into some data and provide a bit of explanation on what drives the numbers.
Let’s take a look.

Key Takeaways
- U.S. oil production has hit 10.769 million barrels per day, yet another record. After only marginal gains in the last few weeks, the strong 44,000 bpd weekly increase eased concerns that infrastructure bottlenecks were restraining production growth.
- Still, bottlenecks are a concern, resulting in a wider WTI discount this week.
- WTI weakness, however, led to a large increase in U.S. crude oil exports.
- The crude stock draw was larger than expected, but it didn’t do much to rescue oil prices.
1. Inventories back to average
(Click to enlarge)
- The oil market is tighter than at any point in the last few years. The metric that most analysts (and OPEC) have been watching is the level of oil inventories relative to the five-year running average.
- Inventory levels exploded during the downturn, with OECD stocks surpassing 3 billion barrels. That coincided with a period in which oil prices plunged below $30 per barrel.
- The OPEC cuts helped drain inventories. Since the beginning of 2017 when the deal began, OECD stocks have declined by 234 million barrels through April 2018. The U.S., specifically, saw inventories fall by 162 million barrels.
- Both U.S. and OECD stocks are now below the five-year average, although it should be noted that the “average” is calculated on a rolling basis, which means it has climbed as it is increasingly defined by the surplus years.
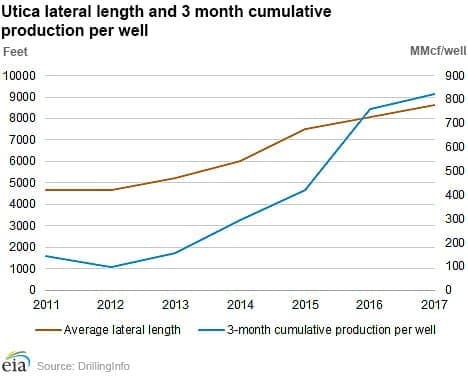
2. Longer lateral length boosts production
(Click to enlarge)
- Shale gas companies are drilling longer laterals, which is increasing both natural gas production and well productivity.
- Lateral length has increased by roughly 75 percent since 2012, and the cumulative 3-month production from new wells has increased 8-fold over that timeframe.
- In 2017, gas production in the Utica shale in Ohio averaged 4.9 billion cubic feet per day (Bcf/d), up 23 percent from a year before. As of April 2018, production was up to 5.8 Bcf/d.
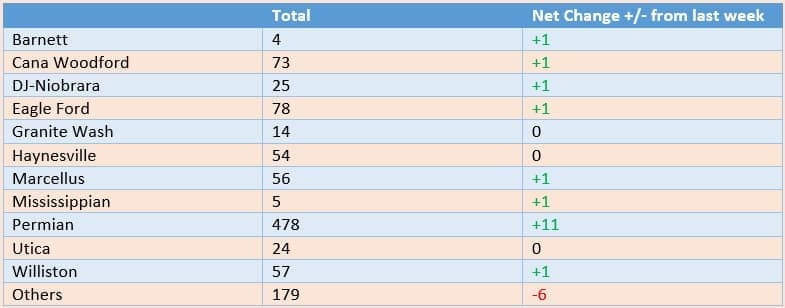
- Higher production comes even as the rig count has declined and prices have fluctuated. The rig count in the entire Utica is only 24, half of what it was back in 2014.
3. Volatility jumps as market becomes jittery
(Click to enlarge)
- Financial volatility jumped this week on political turmoil in Italy, the restart of the U.S. trade war with a good portion of the world (Canada, Mexico, the EU and China), and oil price volatility.
- The CBOE VIX index, which measures volatility, began rising last week after news that OPEC and Russia might boost oil production. The VIX jumped more than 35 percent between May 24 and 29, before falling back in the latter half of the week.
- Still, the financial markets are not as unstable as they were a few months ago. In February the VIX briefly spiked to 35, triple the level of volatility from January.
- For now, oil price volatility has remained relatively low, aside from the plunge last week. In 2015 and 2016 it wasn’t exactly rare to see oil prices rise or fall by 5 percent on a day-to-day basis, but that level of volatility has all but disappeared since OPEC returned to market management a year and a half ago.
4. Benchmark oil prices see widening differentials
- The top two global oil benchmarks – WTI and Brent – have closely tracked each other for years. Prior to the lifting of the U.S. crude oil export ban, and before a series of Permian pipelines were constructed, WTI suffered a double-digit price discount relative to Brent, a reflection of a U.S. glut relative to the rest of the global oil market.
- U.S. infrastructure caught up and the export ban was lifted in 2015, and WTI and Brent closely tracked one another for years.
- The discount has recently blown out again, surpassing $10 per barrel this week for the first time since 2015. Surging Permian production is running into a midstream wall, with pipelines at full capacity.
- The situation is worse specifically in the Permian. Prices in Midland (West Texas) are trading as much as $20 per barrel below the price at the Magellan East Houston Terminal (the Midland-MEH differential).
Heard on the Street
On the wisdom of OPEC boosting production:
“This supply response is occurring because of the existing tightness of the oil balance, with inventories now well below their 5-year average. Further, the strength in demand (and its likely underestimation), the rise in disruptions, and the looming constraints to further shale production growth are all putting the oil balance on a path of signi?cant shortages. We recently estimated that a lack of an OPEC/Russia supply response would lead inventories to historically low levels by 1Q19. In short, this supply response was needed.” – Goldman Sachs
Is an increase in OPEC/non-OPEC production enough?:
“A reduction in OPEC compliance to 100% would mean oil supply returning by 640kbd based on Jan-Apr’18 average or 800kbd based on high compliance month of Apr’18. But would that be enough to offset the risk of decline from Iran, Venezuela and Angola on the back of rising geopolitical risk?” – JP Morgan Chase
The revolution will be electric:
“The global stock of electric cars surpassed 3 million vehicles in 2017 after crossing the 1 million threshold in 2015 and the 2 million mark in 2016…The number of electric light-duty vehicles on the road reaches 125 million by 2030…In this scenario, the EV fleet in 2030 is expected to displace [2.57 million barrels per day] of diesel and gasoline demand.” – The International Energy Agency
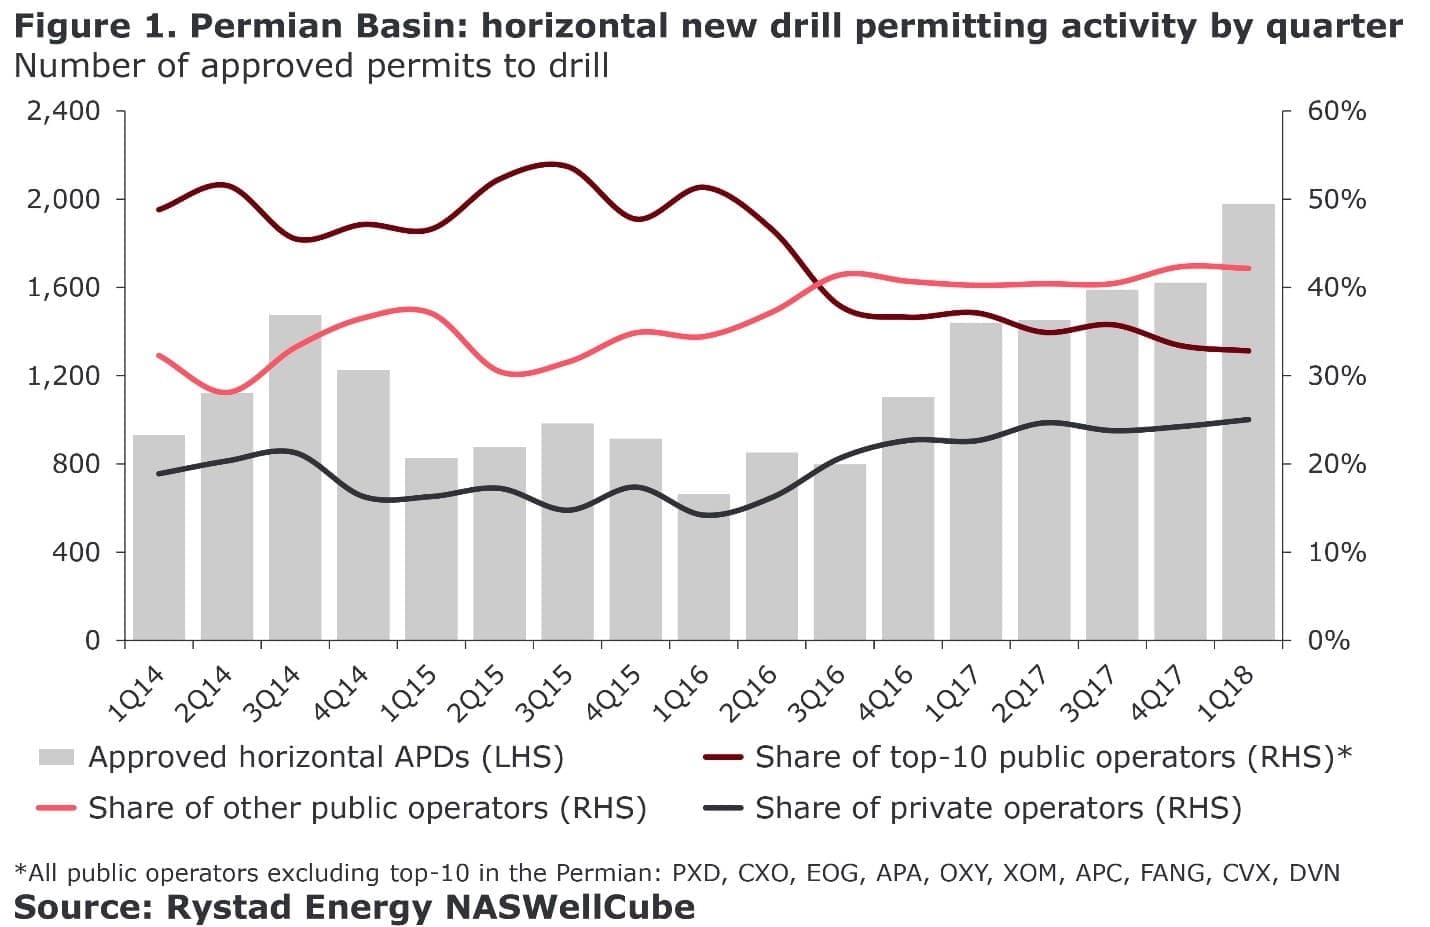
5. Drilling rises in Permian, driven by private companies
(Click to enlarge)
- Publicly-traded E&Ps attract the most attention in the Permian, however, lesser known private companies are now driving growth as the region faces larger obstacles and bottlenecks.
- There were 1,978 horizontal well permits to drill that were approved in the first quarter of 2018 in the Permian, up 22 percent from the previous quarter.
- The top 10 shale players represent a declining share of those permits, from over 50 percent in 2016 down to about a third in the first quarter. Private companies “have been gaining this segment of the market share systematically since mid-2016,” according to Rystad Energy, growing from less than 20 percent of approved permits to about 25 percent in the first quarter.
- Larger publicly-traded shale companies are under pressure to keep spending in check.
- The pace of drilling is also up for private companies, although the share of production is at a more modest 17 percent, which is a function of private companies plying less productive sub-basins.
6. Dollar to oil ratio turns positive
(Click to enlarge)
- The strength of the dollar and the run up in oil prices in recent months have combined to turn the correlation between the two positive.
- Typically, the greenback and oil present an inverse relationship. Oil is priced in dollars, so a rising dollar should cut into demand, pushing oil prices down.
- Over the past month, up until oil prices corrected, Brent gained 10 percent at a time when the Wall Street Journal Dollar Index gained 3 percent.
- Over the past week, however, the decline of oil came as the dollar rallied a bit.
- Since mid-2014, when oil prices crashed, the dollar and oil prices have only moved in opposite directions about half of the time, according to the WSJ.
- “The correlation is simply not working at the moment,” Tamas Varga, an analyst at brokerage PVM Oil Associates Ltd., told the WSJ. “Oil prices are being driven by geopolitics—every- and anything else is currently pretty irrelevant.”
- The negative correlation could reemerge if higher oil prices start to cut into demand growth.
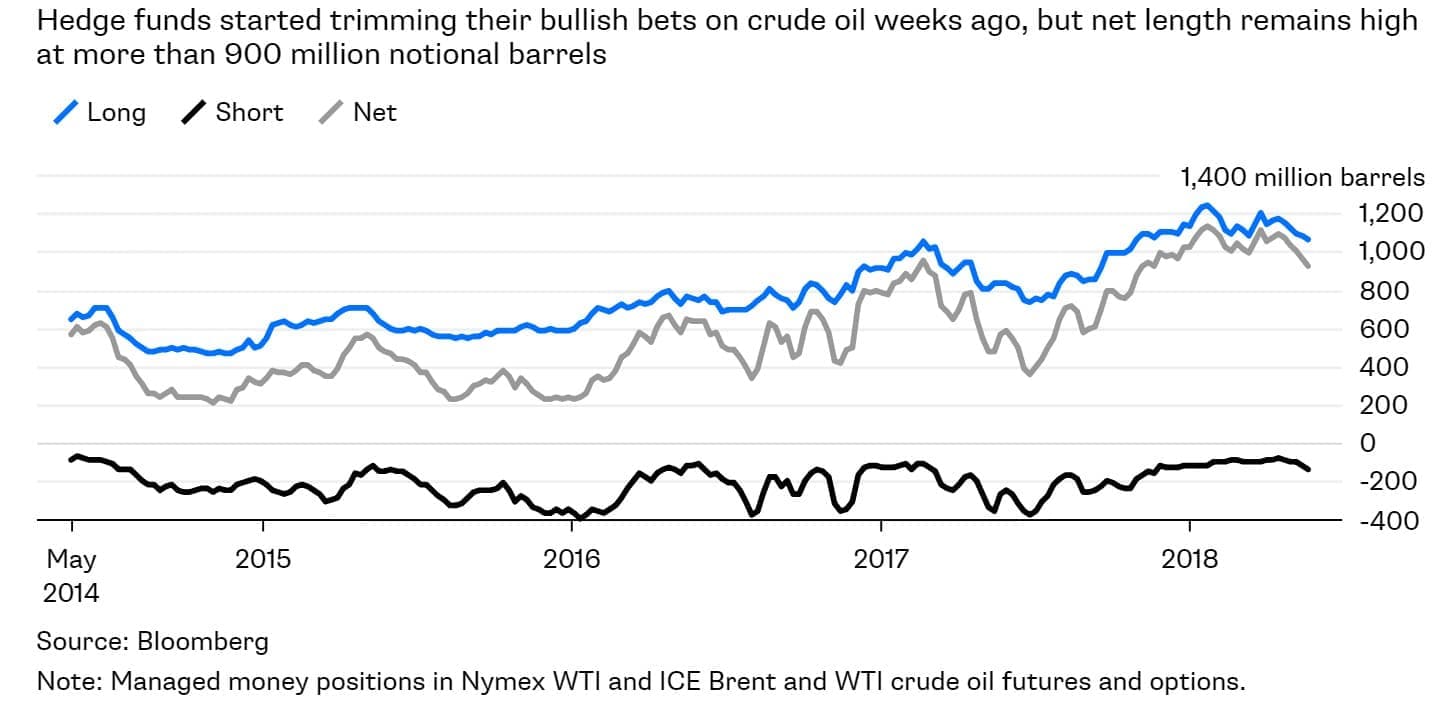
7. Hedge funds cutting bullish bets
(Click to enlarge)
- Hedge funds and other money managers began cutting their bullish positions in April, but the selloff looks set to accelerate with oil prices in retreat.
- Long positions in the three large oil contracts fell for five consecutive weeks. Net-length peaked at 1,134 million barrels in January, and then hit a recent high point at just over 1,100 million barrels in late March. Since then, net length has declined modestly.
- The net length still looks a bit overstretched, which presents downside risk to oil prices.
- OPEC and Russia are still driving the narrative. If they decide to add significant volumes of oil back into the market, the bearish spark could lead to speculators unwinding their bets, which could drag down oil prices.
That’s it for this week’s Numbers Report. Thanks for reading, and we’ll see you next week.