Indicators To Watch As Oil Stocks Flop
By Editorial Dept - Oct 12, 2018, 6:00 PM CDT
Energy markets truly came off the rails Wednesday as the Fed chose to make another rate hike, and Treasuries, especially on the short end of the curve, really took a hit.
The impetus for the sell-off in energy, and commodities in general might have been the Fed’s move, but the real gasoline that kept the fire going through Thursday was the continuing indications that the U.S. trade war with China isn’t going to see a quick end as it did in Mexico and Canada.
We know commodities are the tip of the spear in trade wars, taking the initial brunt of the damage, while stocks and consumer prices are hit later on, if the damaging behavior continues. We had noted a number of indications that energy prices were due for a retracement last week anyway, including the ratio of long specs to shorts in crude oil and the flattening of the crude curve. And, on balance to the last drop from these indications we saw in August, oil is still putting up a better fight, “only” down $5 dollars to August’s $10 from top to bottom, at least so far as of this writing. We’ll have to see as the trade war escalates, whether the strong fundamentals will continue to overshadow these threats to global growth.
Most of the indicators that we noticed this week aren’t looking immediately promising.
Again, crude spreads came in steadily, with the curve of prices now getting perilously close to reverting from a backwardated to a contango condition. It was, of course, a strongly bullish signal…
Energy markets truly came off the rails Wednesday as the Fed chose to make another rate hike, and Treasuries, especially on the short end of the curve, really took a hit.
The impetus for the sell-off in energy, and commodities in general might have been the Fed’s move, but the real gasoline that kept the fire going through Thursday was the continuing indications that the U.S. trade war with China isn’t going to see a quick end as it did in Mexico and Canada.
We know commodities are the tip of the spear in trade wars, taking the initial brunt of the damage, while stocks and consumer prices are hit later on, if the damaging behavior continues. We had noted a number of indications that energy prices were due for a retracement last week anyway, including the ratio of long specs to shorts in crude oil and the flattening of the crude curve. And, on balance to the last drop from these indications we saw in August, oil is still putting up a better fight, “only” down $5 dollars to August’s $10 from top to bottom, at least so far as of this writing. We’ll have to see as the trade war escalates, whether the strong fundamentals will continue to overshadow these threats to global growth.
Most of the indicators that we noticed this week aren’t looking immediately promising.
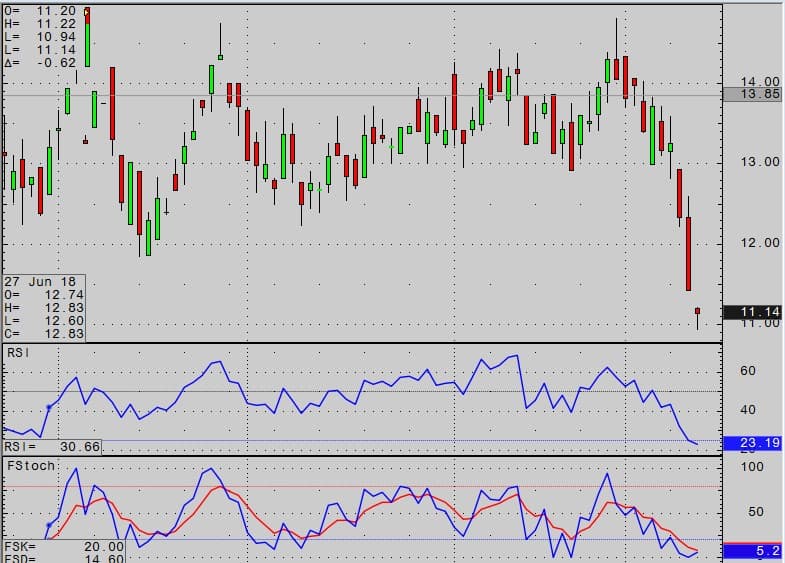
Again, crude spreads came in steadily, with the curve of prices now getting perilously close to reverting from a backwardated to a contango condition. It was, of course, a strongly bullish signal as markets fought out of a long period of contango to a premium state during much of 2017 through 2018, now acting as if that might have been just an overshoot of their ‘normal’ condition. Below, a typical representation with the December-March (Z8-H9) spread:

(Click to enlarge)
On the positive side, this spread and others are showing a strong oversold condition as is another interesting intermarket relationship:
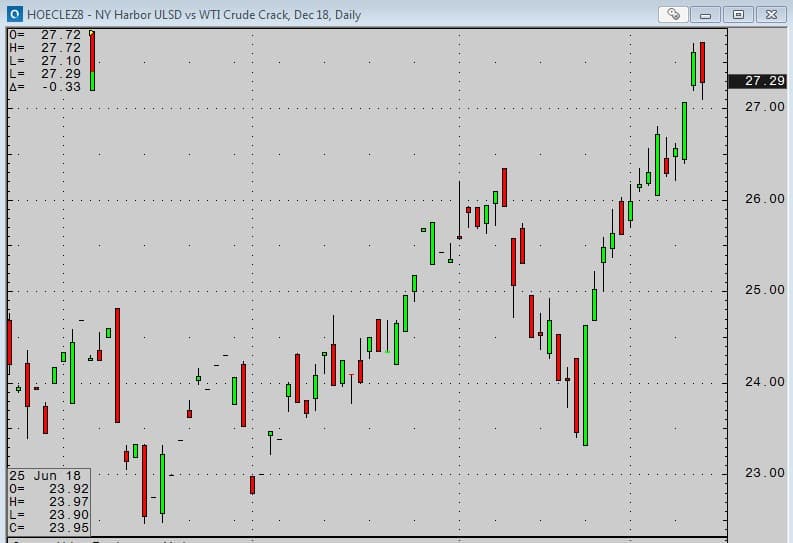
Here is the December gasoline crack, showing the disaster that spread has withstood during this relatively benign $5-dollar downturn.
During the summer and early fall months, gasoline and the strength of summer and early shoulder cracks contributed mightily to the run in crude prices through and above $70 a barrel. Even through the early part of the winter trading of gas cracks, we saw a very steady strength in gasoline – but that all hit the skids this week. Even if there is a reflexive recovery in these spreads, it would be a very worrying sign indeed if gasoline no longer remained the ‘leader’ to the moves to the upside in energy. Contrast this to the strength that we’ve seen in heating oil cracks.
(Click to enlarge)
One might think that oil cracks showing strength heading into the winter, while seeing gas cracks weaken simultaneously is a natural occurrence – but this intuitively ‘correct’ market move is historically not always a good sign at all. Market leadership from gasoline has proven to be historically more powerful than leadership from heating oil, diesel and other liquids. This bear’s careful watching in the weeks ahead.
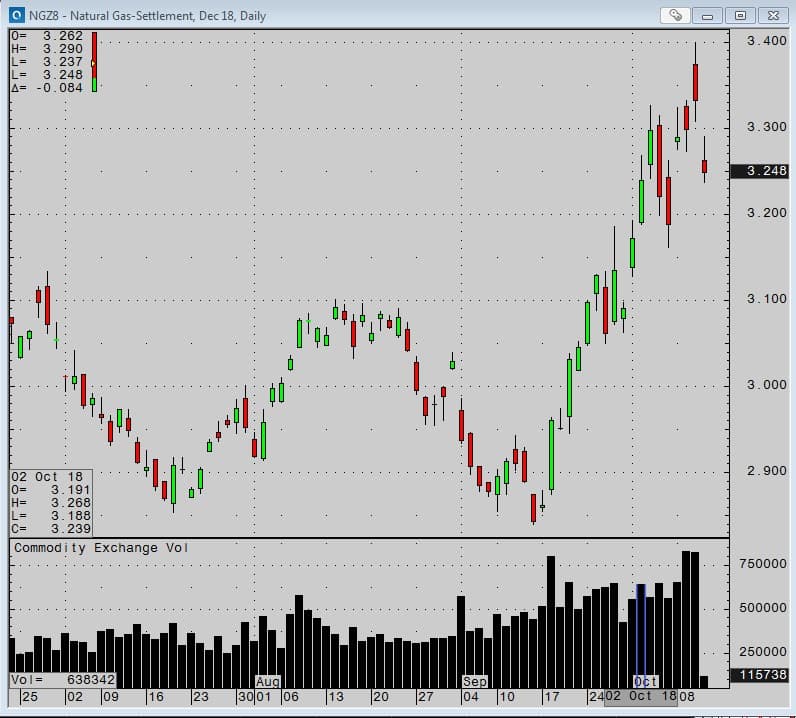
A quick look at natural gas, which may be the silver lining of the energy space. Gas has been holding its own last week, until the Wednesday downtick moving smartly higher on very strong volume, a great sign:
(Click to enlarge)
In addition, futures continue to run only about $0.10/mmbtu above cash market prices at the Henry Hub, far below the premium we saw last year. Despite the therefore natural ‘arb’ to reduce injections and put pressure on prices, we’ve seen gas actually fight this and stay strong. Indeed, if there are trade war issues that the energy markets need to work through, they’ll be least affected by a completely domestic market like natural gas, where the impact of LNG exports won’t be powerfully felt on prompt prices until at least the middle of 2019. If there is a ‘safe haven’ in the commodity space and the energy space in particular during this volatile market time, it may be found in natural gas.