American shale peaked in February of this year, and is on glide path lower as the drilling decline takes its toll on legacy production. As shown in the chart below, as a result of well shut-ins and drilling declines shale production reversed its trend upward, has begun a decline that we think will reduce shale production by half as we exit 2020. The dotted red line is the EIA’s estimate for the amount of the drop in June. I think they are a bit optimistic, although the current restart of legacy wells may be included in this calculation. It won’t matter as the year ages, shale is going to decline majorly as we exit this year. I will have some calculations later in this article to validate that position.
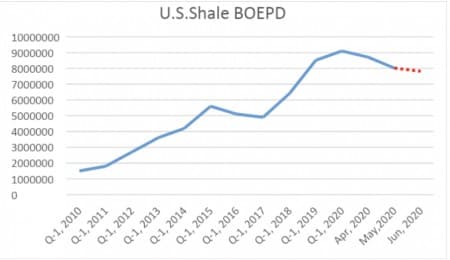
EIA-Chart by author We are now moving into a time that I have forecast in a number of previous OilPrice articles, where certain key factors will mean the difference between survival, and value destruction as the industry consolidates. Here is a quote from the most recent, “Supermajors Are On The Prowl For Fresh Deals In The Permian.”
- Rock quality
- Scale
- Logistics
- Low costs of production
- Technology
In this article we are going to circle back to focus on rock quality as being a driver for growth as the Permian begins to restart. This is what the rivalry between Chevron (NYSE:CVX) and Occidental (NYSE:OXY) back in 2019 was all about from the start. Who would be the lowest cost domestic producer? The stakes were always high, OXY won the battle, and it almost killed the company. It still could as OXY looks to reschedule ~$40 bn in debt. We think much of the danger has passed for this operator however and will discuss in this article why as oil prices rise, OXY could benefit out of proportion to other shale players.
The Permian is the King of Oilfields

A little over a year ago I published an article in OilPrice in which I made a case for the Occidental Petroleum, (NYSE:OXY) takeover of Anadarko would payout in the long run due to quality of reservoirs in the acreage. It was appropriately entitled, “What The Market Is Overlooking In The Occidental Deal,” and is worth going back reading for the technical detail it contained on the rock quality in this section of the Permian.
The Prize both CVX and OXY coveted
If you look closely at the graphic below you can see what the Anadarko acreage (shown in blue) meant to both companies. It is located right in the heart of the deepest part of the Permian, and is what yields the most prolific wells.
Related: Why Oil Prices Didn’t Rally After The OPEC+ Extension

It is simply among the best rock on the planet for producing oil. If you refer back to my 5-point thesis, you see rock quality is number one.
What that means is the wells that are drilled will respond more fully, and for a longer time period than well drilled and completed in more marginal rock. This will improve EURs, and provide more cash flow per foot of interval through lower decline rates. Essentially this adds up to more oil from fewer wells, with associated cost savings to the operator, and value to shareholders!
What is most likely path for oil over the next couple of quarters?
As I noted in the first graphic showing the sharp decline in shale production, we are headed in an almost “parabolic” direction for this commodity. The harsh realities of lack of investment through the capital discipline that began in early 2018, are finally beginning to affect the market’s ability to obtain new supplies. The Rystad graphic below shows the effect of the well shut-ins to this point, although with estimates for a staged recovery that has just begun.
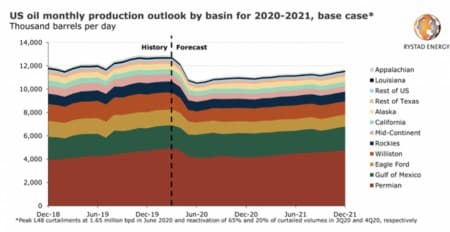
We find no basis to challenge the Rystad numbers above as they are presented, but don’t think they give an accurate picture of the total situation affecting oil availability going forward. Where we part company from Rystad is accounting for "lost" new production from drilling.
Shale wells are in factory-mode these days. Sink a well, frac it, and hook it up to a flowline, and you've got production. There's plenty of takeaway infrastructure these days, thanks to the Energy Transfer's (NYSE: ET), and Kinder Morgan's (NYSE:KMI) of this world. What we don't have is the drilling part of this equation.
Related: U.S. Gas Drillers Face A Major Problem
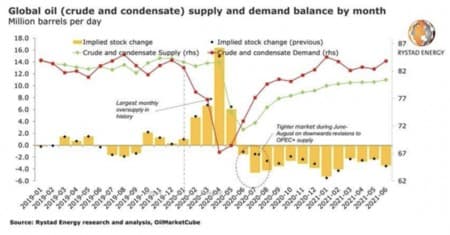
Rystad figures as noted in the chart above project that we will exit 2020 with global demand at ~84 mm BOPD (I think they're light), and supply at about ~70 mm BOPD. That's a gap of ~5-mm BOPD.
What's the number with lost production from drilling?
Using EIA numbers of new production per rig from the most recent Drilling Productivity Report, DPR you have 745K new bbls per active rig. As of last Friday, Baker Hughes tells us that there are 284 rotary rigs punching holes in the ground. That's ~210 K bbls per day of incremental production, or ~77 mm BBLs total for the year. That may sound like a lot, but remember what the decline rate is for shale...it's 60% (a conservative figure) per annum. Using the same EIA forecast we see the expectation is that we will produce 7,822 mm BOPD from shale in June, 2020. So let's do some ciphering!
7822 X (.60 / 12 X 6) = ~5.4 mm BOPD +(350 X 800) = ~5.7-mm BOPD, or a decline of about 37% from the Feb, 2020's high of ~9 mm BOPD.
Note- I was generous in my calculation and assumed that rigs and bbls per rig would rise through the year. So, if you take this admittedly over-simplified calculated number and subtract it from the 11.2 mm BOPD Rystad shows from all sources in the graphic above... you could see U.S. production falling below 8 mm BOPD as we exit 2020. The world isn't ready for this. Note-These calculations are very simple and attempt to approximate the outcome of some way more complex influencing factors.
OXY-Your takeaway
OXY has suffered along with the general market malaise in Q-1, with shares dropping almost 80% at their lows. The company has staged a resounding recovery in recent weeks, attaining over half their pre-crash valuation. This rise hasn’t escaped the analyst’s attention at BoA, moving the company to a “Buy,” today from neutral, citing the potential for the company to generate as much as $7 bn in Free Cash flow over the next year and a half.
Raymond James, an energy securities analyst has reiterated a “Strong Buy,” on the company citing a 9% Free cash flow yield.
If you accept my argument that oil prices are headed higher an investment in OXY could be a good way to play this bet. OXY currently is the Permian’s largest producer with daily liftings of 442K BOPD, with its lowest cost at $6.25 per BOE. As prices for oil continue to rise the company will benefit from an aggressive hedging program and higher overall production.
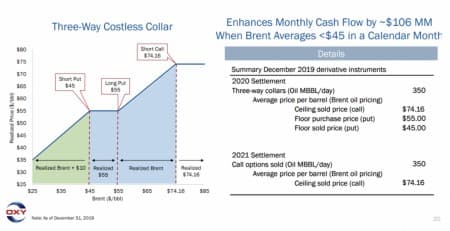
Improved cash flow as the analysts mentioned above should drive the stock price higher. Currently trading at roughly 2X Q-1’s estimate of ($9.14 FCF per share), the company has traded at more than 5X this metric in the past year. We think this gives a lot of room for shares to appreciate as liquidity fears from low oil prices fade in the coming quarters.
The company is trading down today off $1.84 from a recent high seen yesterday, on weakness in the oil price. We think this is very transitory, and the company can be safely bought at this level, subject to reader’s own due diligence and risk tolerance.
By David Messler for Oilprice.com
More Top Reads From Oilprice.com:
- Why Saudi Arabia Will Lose The Next Oil Price War
- $35 Brent: Goldman Sachs Turns Bearish On Oil
- Morgan Stanley: This Oil Rally Won’t Last


