


Crude markets had a panic attack in August and September that sent prices soaring. Sanity is now returning. Prices have fallen but are likely to move even lower over the next few months.
The panic attack was caused largely by Trump’s August 7 announcement that sanctions would be re-imposed on Iran. Anxiety about the effect on oil supply and prices was reasonable but the reaction was hysterical.
From August 15 to October 1, Brent December futures spreads increased $3.01 (175 percent) from $1.72 to $4.73. Brent prices increased $15.53 (22 percent) from $70.76 to $86.29 (Figure 1).

(Click to enlarge)
Figure 1. Brent Dec spreads collapsed from $4.73 to $1.52 since Oct 1 & are now less than when price rally began after announcement to re-impose Iran sanctions in mid-August. Front-month Brent down from $86.29 to $76.17 but still higher than $70.76 Aug 15 price. Source: Barchart and Labyrinth Consulting Services, Inc.
Then spreads and prices collapsed. By October 24, spreads had fallen from $4.73 to $1.52, less than when the price rally began. Front-month Brent price decreased from $86.29 to $76.17. Prices and spreads recovered slightly on October 24 closing at $76.89 and $1.76, respectively.
It seems unlikely that the correction is over. The timing depends on how long it takes for markets to fully recover from what Vitol’s Ian Taylor calls the supply fear factor. After 6 weeks of fear, markets must adjust to the reality that the “oil market is adequately supplied for now.”
Related: EIA: Market Tightens As Outages From Iran, Venezuela Pile Up
Clearly markets are concerned about more than just Iran. Falling or uncertain output from the problem children Venezuela, Libya and Nigeria, and take-away constraints from the Permian basin are critical.
Iran, however, is different because it is a completely artificial supply crisis. It was a choice made by Donald Trump and his advisors. Markets are used to the uncertainty of its problem children but not to the apparent certainty of an executive decision. The reaction was consistent with the cause—certain and linear.
It was also wrong.
World liquids production has, in fact, increased 2.91 mmb/d so far in 2018. Much of that increase came from producers other than U.S. & OPEC (Figure 2).

(Click to enlarge)
Figure 2. World liquids production has increased +2.91 mmb/d TYD 2018. Output from rest of the world excluding U.S. and OPEC increased after May 2018. Source: EIA STEO and Labyrinth Consulting Services, Inc.
That data, of course, includes losses from Venezuela, Iran, Libya, and Nigeria.
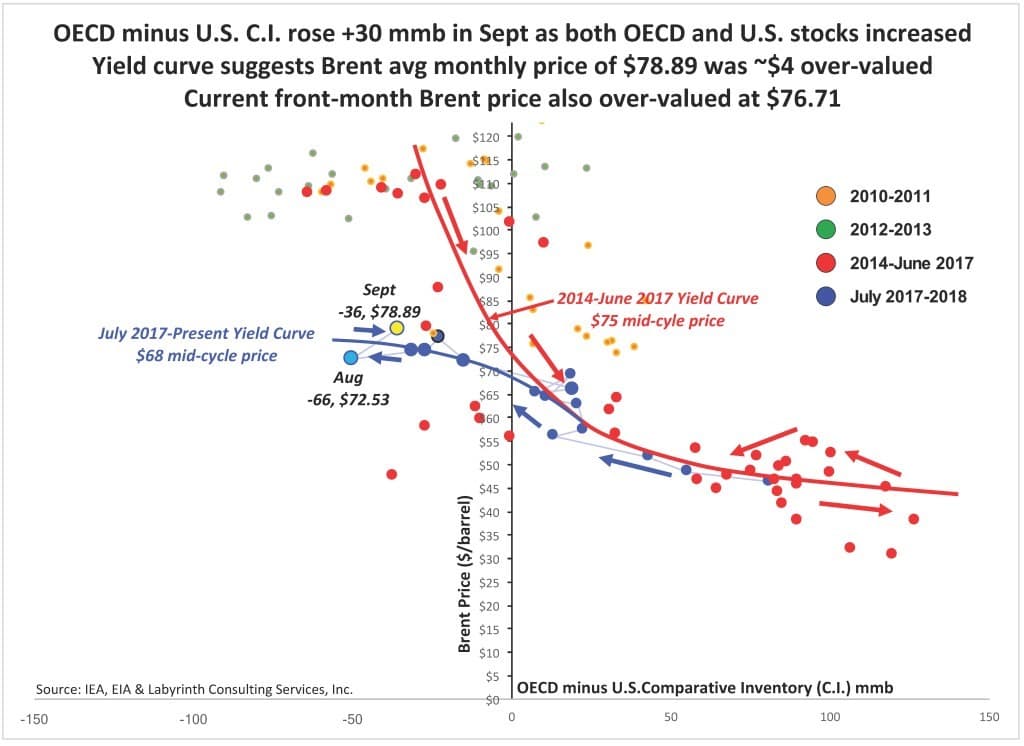
Both OECD and U.S. commercial stocks increased in September moving comparative inventory (C.I.) 30 mmb higher and closer to the 5-year average (Figure 3).
(Click to enlarge)
Figure 3. OECD minus U.S. C.I. rose +30 mmb in Sept as both OECD and U.S. stocks increased. Yield curve suggests Brent avg monthly price of $78.89 was ~$4 over-valued. Current front-month Brent price also over-valued at $76.71. Source: IEA, EIA and Labyrinth Consulting Services, Inc.
Related: Will Big Oil Ever Win Back Investors’ Trust?
This data is consistent with the July 2017-through-present yield curve shown in Figure 3. Based on that trend line, the September Brent average price of $78.89 was approximately $4.50 over-valued. Today’s front-month price of $76.23 is still over-valued by about $2.00.
Data further suggests that OECD and U.S. C.I. may have reached a minimum and will continue building later in 2018 and into 2019.
“We expect an oversupply in 2019, we may have to go back to the reduction,” Saudi Energy Minister, Khalid al Falih commented in late September.
Positive oil supply growth began in the first quarter of 2018 and price generally lags the shift to positive growth by several quarters (Figure 4). This is important because it signals a probable lessening of or end to the upward movement of oil prices that began in early 2016.

(Click to enlarge)
Figure 4. Oil prices will probably be lower going forward into 2019. Positive world liquids supply growth began in 1Q 2018. Price generally lags shift to positive supply growth by several quarters. Source: OPEC, EIA STEO and Labyrinth Consulting Services, Inc.
Year-over-year supply growth for the third quarter of 2018 was 2.35 mmb/d according the the IEA latest Oil Market Report. Year-to-date supply growth is about 2 mmb/d.
The last time a secular shift like this occurred was in early 2014. The previous deficit shifted to supply growth in the first quarter of 2014. Prices, however, remained above $100 until the third quarter. Brent begin to fall in earnest and then collapsed during the fourth quarter of 2014.
I am not suggesting that another oil price collapse is going to occur in 2019. I am saying that data indicates that lower rather than higher oil prices are more likely going forward.
By Art Berman for Oilprice.com
More Top Reads From Oilprice.com:
- The Perfect Storm Bringing China And Russia Together
- Trump Sides With Farmers In Battle Against Refiners
- U.S. Drillers Add 11 Rigs Despite Oil Price Correction


90% September and 88% recently.
How much of the recent rise in inventory is just
due to seasonal maintenance?
I guess we are soon to find out