


Dean Fantazzini has provided his latest estimates of Texas oil and natural gas output.
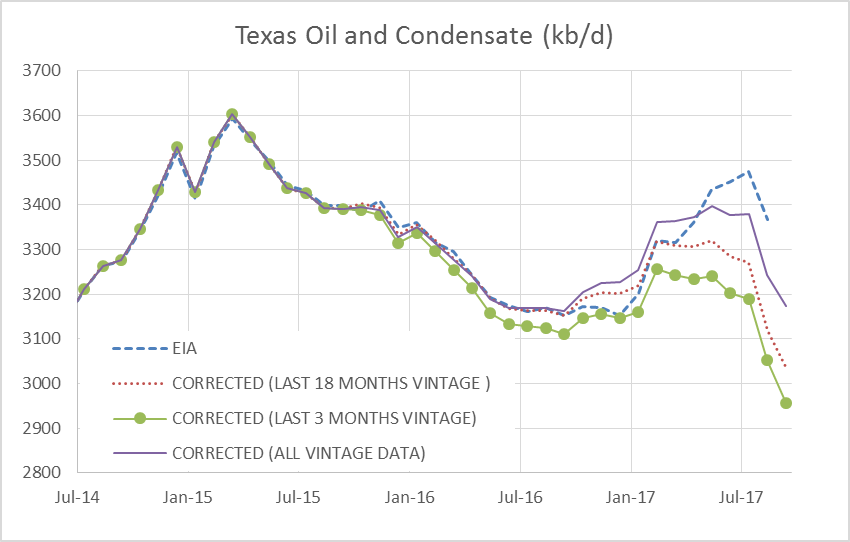
His analysis is based on RRC data only. Each RRC data set from Jan 2014 to Sept 2017 for crude and from April 2014 to Sept 2017 for condensate and natural gas are used in the “all data” estimate, the most recent 49 months of data are collected for each individual data set. After March 2016 there was a shift in the data for crude and condensate so for the C+C estimate, I include an estimate which uses all data from April 2016 to the most recent data point (“Corrected 18 month vintage”). Dean prefers to present an “all vintage data” estimate and an estimate using only the most recent 3 months “correction factors”. For Sept 2017 the all vintage data estimate is 3174 kb/d, the last 3 month vintage estimate is 2957 kb/d, and the last 18 month vintage estimate is 3039 kb/d with falls of 68, 96, and 80 kb/d respectively from the previous month.
(Click to enlarge)
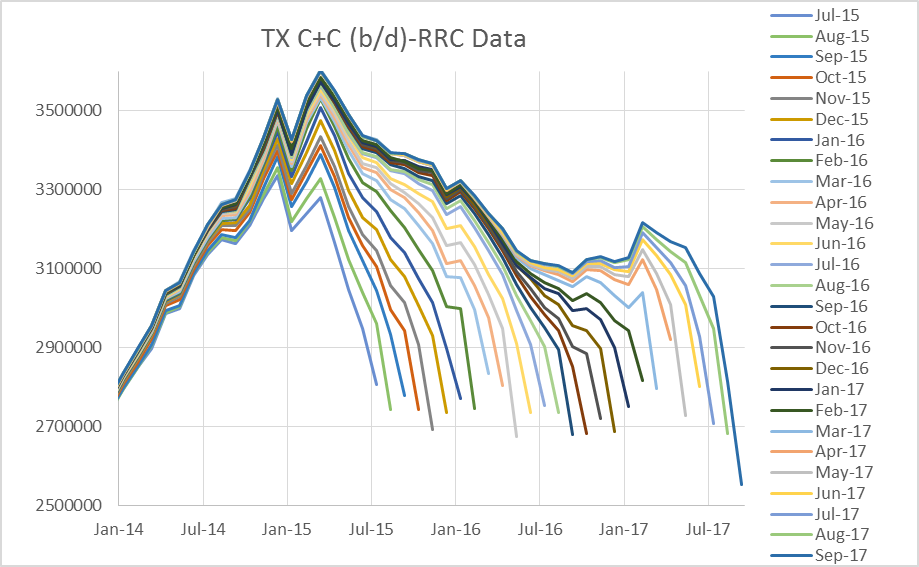
A chart I have not presented recently shows initial data reported for the past 26 months (July 2015 to Sept 2017). The change in the data around July 2016 is pretty clear. Notice how the lines start to become very closely spaced at about 6 to 8 months from most recent estimate, especially for the Sept 2016 to Feb 2017 period. This is an indication that the RRC data is improving.
(Click to enlarge)
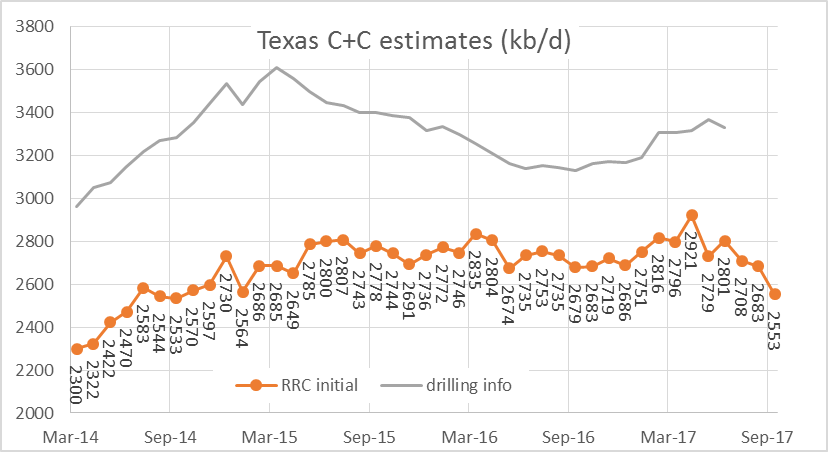
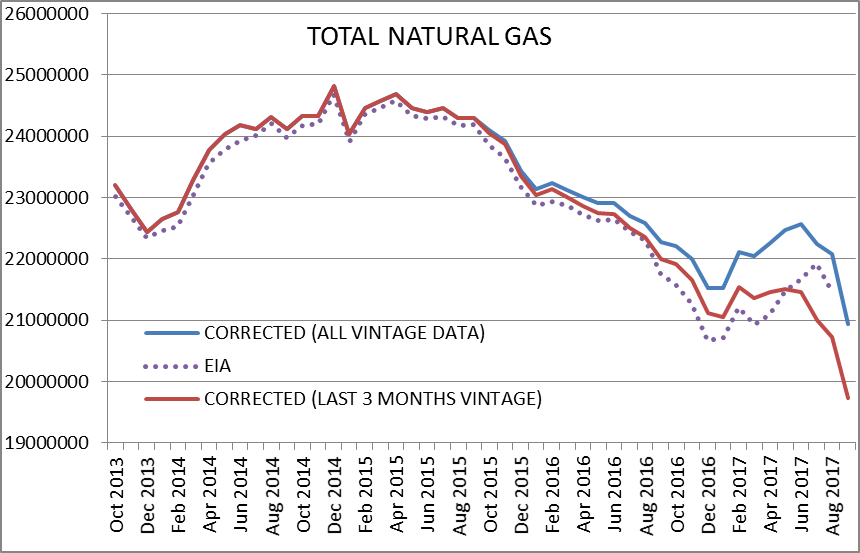
The Chart below is something new. It shows only the most recent data point from each of the data sets since March 2014 and compares with the data from drilling info which can be found at the EIA website. Notice that the RRC initial data from the RRC website’s online query does not always move in sync with the drilling info data due to fluctuations in the amount of pending lease data from month to month and other factors affecting the speed that data is reported and processed. Related: Has The Big Oil Fire Sale Started?
(Click to enlarge)
Note that the best data is from the Texas Railroad Commission (RRC) and is reflected in the data from drilling info. Only the most recent month has incomplete data (about 91 percent of the total) and I have dropped that data point (July 2017) in the chart above, the most recent drilling info data point is June 2017.
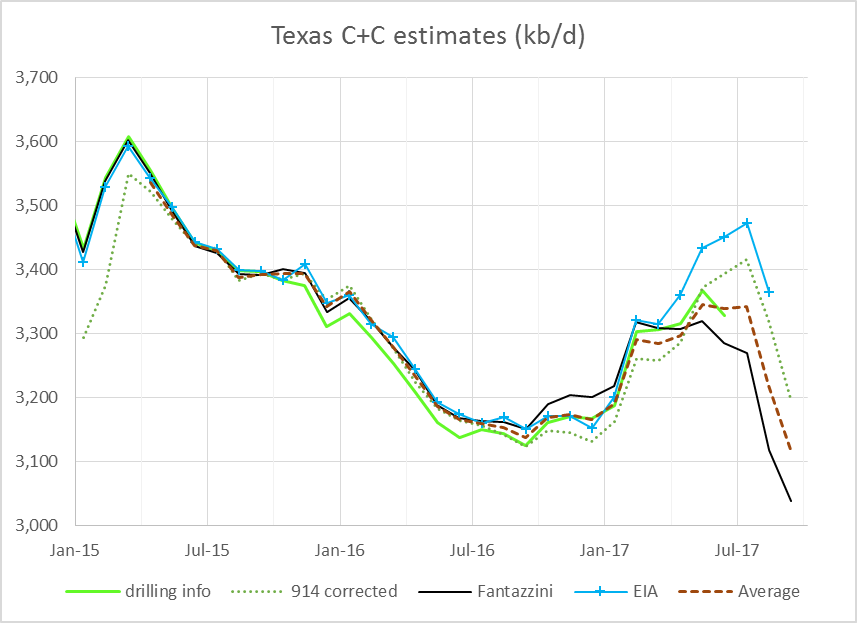
To get an estimate for the July to Sept period, we can use Dean Fantazzini’s data (I use the 18-month corrected estimate) and also a “corrected” 914 estimate. The 914 survey by the EIA surveys large producers to get a basis for an up to date estimate, this data is reported monthly by the EIA.
To correct the 914-survey report, I find the difference between the drilling info data and the 914 survey for each month from April 2015 to June 2017 and then take the average of that difference, which is 319 kb/d. This difference is then added to the 914 survey for each month and is labelled “914 corrected” on the chart below. The data for the 914 survey can be found at the EIA link earlier in the post and an explanation of the 914 survey is found at this link. The short story is that large companies that produce about 90 percent of Texas output respond to this survey by the EIA, which is then used to estimate output. Related: U.S. Oil Rig Count Rises Amid Record Breaking Production
The “Average” of the 18-month corrected estimate from Dean Fantazzini’s analysis (“Fantazzini” on the chart) and the 914 corrected estimate is also plotted. To get an estimate for 914 corrected for September, I use the average difference between the 914 corrected estimate and the initial RRC reported data for June, July, and August (327 kb/d) and add this to the Sept 2017 RRC initial data.
(Click to enlarge)
For the data I have available right now, the best estimate for Texas C+C is represented by the “drilling info” line in the chart above through June 2017, from July to Sept 2017 my best guess is the “Average” line (3119 kb/d in September) with about an 80 percent probability the final data will fall between the 914 corrected estimate (3199 kb/d) and the Fantazzini estimate (3039 kb/d) and about an equal 10 percent chance the final data will be above or below those estimates. In short, the best estimate through June 2017 is based on RRC data (including the pending file).
(Click to enlarge)
For Sept 2017 the all vintage data estimate is 20,942 MMCF/d, and the last 3 months vintage estimate is 19,736 MMCF/d, a decrease of 1145 and 988 MMCF/d respectively.
By Peak Oil Barrel
More Top Reads From Oilprice.com:
- Thanksgiving Travelers Smash Records
- Is This The Ultimate Fuel For Millennials?
- Saudi Corruption Crackdown Could Permanently Boost Oil Prices


