


This briefly covers the production side as the hurricane outages are dominating the trends at the moment, but there’s a section at the end on discoveries and reserves that may give some pointers to future expectations.
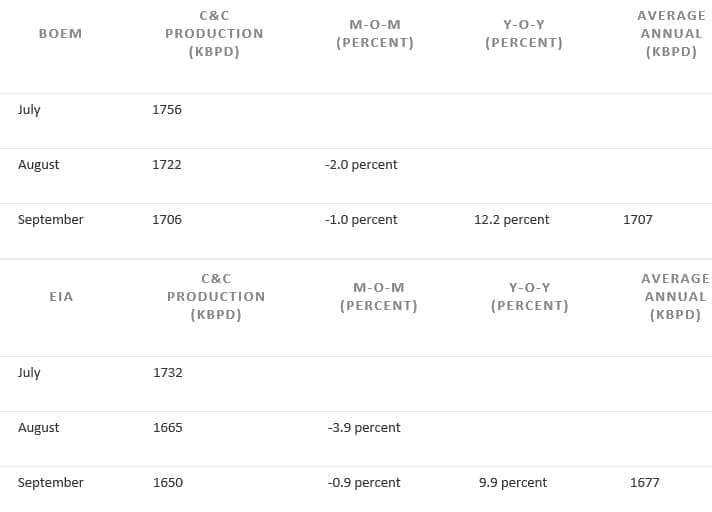
The tables below show the production numbers for September, and their relation with previous months from BOEM and EIA, which are pretty close, but for some reason never the same and have actually diverged quite significantly at the moment. Both sets of data get revised, possibly up to a year later, usually those from EIA more than those from BOEM, and they end up with much closer, with EIA usually slightly lower.
(Click to enlarge)
For August Hurricane Harvey knocked out about 80 kbpd, Irma in September had a similar impact, but some of the increased drop might be natural decline. Nate in October took out about 250 to 300 averaged over the month. In addition, there have been some other unplanned shut downs: Thunder Horse for a few days from an electrical failure following restart after Irma, Delta House following a subsea failure, and a pipeline rupture on Enchilada which took out about 75 kbpd in early November (and is still offline). The Delta House outage has not been reported very extensively but the Rigel field may still be offline, losing 25 kbpd. There is also continued decline in mature fields at about 12 kbpd, which may be accelerating as some of the newer fields are now in decline, and there are no new greenfield developments due until Stampede in first quarter of 2018 – though there may be some in-fill drilling still on some of the larger fields (e.g. Mars, Thunder Horse) and a couple of wells for Phoenix and Holstein (see below).
It remains to be seen but with these outages it looks like this year will not exceed 1700 kbpd on average; it will however still be a record a year, although well down on most predictions from last year, and the exit rate will be below last year’s. Recent adjustments to the EIA numbers now mean that September 2009 remains their peak month, with March this year the secondary peak. Without the outages August might just have edged a new overall peak.
C&C Production
(Click to enlarge)
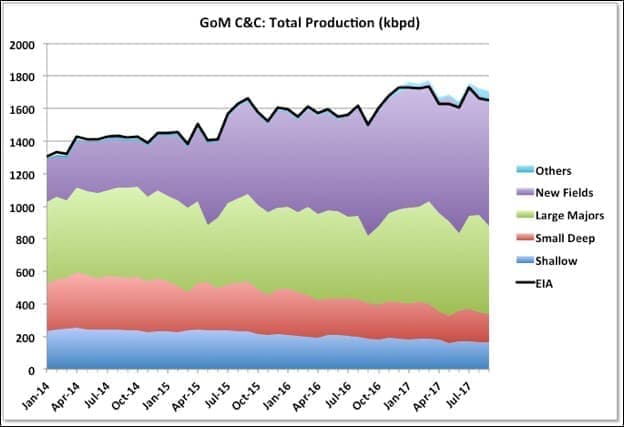
BOEM issue three sets of data that can be used to give total production per month: by well, by lease and their own estimated total. Over time the total by well and their estimate tend to converge (there is usually some missing date in the wells data for as long as twelve months), though for some reason they are never exactly equal – the monthly estimate seems to be about 2,000 bpd higher for most months once all data has been collected. The total lease estimate is always about 10 to 20,000 bpd lower, mostly because of production from test wells and wells with “NO LEASE”, which it doesn’t include. It appears EIA use this lease data with some adjustment for missing numbers in their estimates, though there’s a difference between their STEO and the GoM pages. I use the well data as it’s easy to download and update to the charts in one go. The trouble with that method is that data might be missing for recent months and it’s not easy (i.e. requires more work than is worthwhile) to spot missing data versus data showing no production. If I notice something missing I assume constant production from the last known data point, but might miss some, especially for shallow water leases. However, for this month almost all the shallow leases have missing data, so I’ve kept them all constant. I’ve extended the data back to 2013 as this shows plateaus versus peaks a bit better, and simplified a couple of the charts.

(Click to enlarge)
The new fields look like they are plateauing and maybe starting to decline. The Mars-Ursa fields have been increasing production through 2016 and 2017, mainly from ramp-up of new fields at West Boreas and South Deimos, but also it looks like additional development wells on older fields (without which the total new production only would almost certainly be showing clear decline). I haven’t seen any announcements, but it seems unlikely there will be much more net increase for these fields (see below for a bit more discussion on reserve growth here). Lucius, Cardamom and Great White are three medium sized fields that look to falling fairly quickly at the moment, but there is ongoing or soon to be drilling at them all. Related: Don’t Expect Aggressive U.S. Shale Drilling
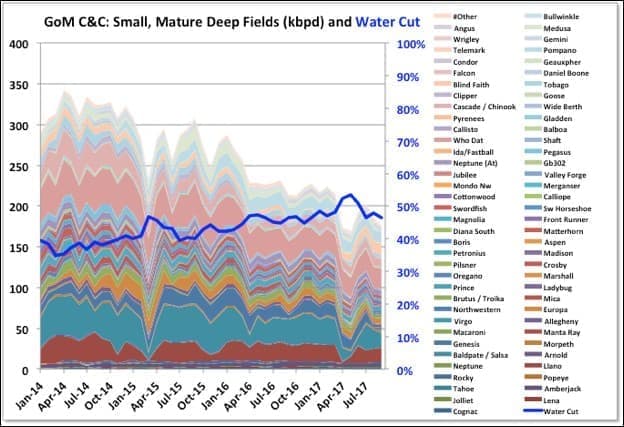
Cardamom is a recent start-up and is one of the deep pre-salt fields in the GoM. It is produced to an old Shell platform, Augur, and has shown quite rapid decline. Augur is one of the platforms currently shut down because of the Enchilada pipeline failure, together with Magnolia and Baldpate/Salsa.
The Delta House fields are Rigel, which was where the recent subsea connector failure occurred, Marmalard, Odd Job, Otis (mostly a gas field) and Son of Bluto 2. They got to 92 kbpd in September, which is probably about as good as they can do on average without exceeding nameplate. There hasn’t been much information on the extent of lost production there, from either LLOG or BSEE, and it might not become apparent until the November field production figures are released. Also notable is that Stones was offline for most of the September after just about reaching nameplate.

(Click to enlarge)
I’ve lumped all the fields operated by the larger producers that are not shown in the new fields chart here. This is the group that was most affected by the forced outages in August and September. They are holding a plateau, with a slight increase recently because of Thunder Horse South, but it takes continuous drilling to keep them there and that may start to become less effective as most of the platforms are getting past 10 years, which is usually the limit for plateau design.
(Click to enlarge)
The mature deep-water fields continue to decline; possibly slightly accelerating. The two largest producers, Llano and Baldpate/Salsa (brown and cadet blue near the bottom) will both be shown offline from November because of the Enchilada issue, but even before that they were in fairly rapid decline).
There wasn’t much new data for the shallow fields in September, possibly because of hurricanes, but there’s no reason to think the general decline won’t continue (see below).
Deep Water Drilling, Discoveries And Production

(Click to enlarge)
The chart below shows details for deep-water leases only (including production, and also note the units which allow things to fit better on the right-hand access). Gas is a pretty reasonable bell curve, but influenced a lot by increasing associated gas, which changes in line with the oil. The C&C might have been closer to a bell curve except for big bites taken out by the 2008 financial crisis and the drilling hiatus following Deep Horizon. It’s difficult to pick out a pattern that would indicate what the exact delay between wells/discoveries and production, but it looks to be around fifteen years.
New wells and discoveries are tailing off. I think this year will be in line with the declining trends. What this chart doesn’t show, but see below, is the discovered reserve size, and this is tending to decline faster than the actual number of discoveries. There aren’t many undeveloped leases remaining (shown as qualified – mostly newer and likely to be produced, or open – older and maybe waiting for much higher oil prices). There may be new fields in operating leases, which wouldn’t be apparent (one of the difficulties of the way BOEM reports against lease numbers) but I don’t think there are many.

(Click to enlarge)
GoM drilling over the past six months is at all-time lows for the period since Baker-Hughes data has been available, but a lot in the past were for gas and oil rig numbers are still fairly robust. The E&Ps definitely went full on boom cycle in the GoM during the high price years from 2012 to 2015, possibly partly catching up from the hiatus after Deep Horizon.
Future Production and Developments
Anadarko are cutting overall investments in 2018 compared to this year and are starting share buy backs; they have stated that they will drill a maximum of five GoM development wells on a budget of $1.1 billion. I’d estimate that would give 20 to 30 kbpd new production. There was no mention of new tie-backs, so they seem likely to be wells into existing fields using existing subsea infrastructure (e.g. for Marlin/King/Horn Mountain, where they have had successful new wells this year, Lucius/Hadrian North or Holstein/Fresian). They and BP are also developing the Constellation tie-back to Constitution, expected for mid-year at about 12 kbpd average oil. The Phobos appraisal well was not encouraging and they have shelved that tie-back, which would have gone to Lucius, at least for now. They also have options with the Shenandoah complex, which has been downgraded from a stand-alone project but may be amenable to tie-backs, and also have the Warrior discovery under appraisal, which would go to Marco Polo (but one section of that area has been investigated and found to be unattractive so reducing the resource base).
LLOG have given details of a number of developments for Crown and Anchor, Claiborne, Blue Wing Olive and Red Zinger. Unlike Anadarko these wells exist, drilled for exploration or appraisal, but require new flowlines and umbilicals for production. Tie-back wells typically flow 3 to 10 kbpd, though some can get to 20 kbpd initially, but usually immediately start to decline at about 20 percent per year, sometimes higher.
Stampede will start up early in the year and has pre-drilled wells so should ramp-up quickly, but I think they only have nameplate well capacity for about 40 kbpd oil (average production will be less, especially in the first year). Big Foot is not due until the fourth quarter, has only two fully pre-drilled wells and likely won’t contribute much in 2018. The other thirteen wells have the top two conductor sections drilled but will be completed by the platforms rig; it is fairly heavy oil so will likely need all available wells, which will use ESPs, to achieve full capacity at 75 kbpd.
The Atlantis North development should continue through the year, but for all the publicity about new seismic technology uncovering new oil this year, it seems they are only just about able to maintain a plateau there as the wells decline very quickly.
Talos made a discovery at Tornado II in October, which will be tied in with the Helix Producer in December. It flowed at 16.8 kboed on test, but that will be lower (say by 20 percent) for oil only and less overall against the backpressure of a flowline; and may also back out other online production if it raises overall backpressures on producing wells, so probably less than 10 kbpd of oil net average increase. The switch to lower risk, near field exploration is allowing some companies to reduce overall decline rates on existing facilities, but it is a bit of a Red Queen treadmill, and eventually the prospects are going to dwindle.
BHP, which operate Shenzi and have other holdings in GoM where most of their conventional oil and gas is produced including a 44 percent stake in Atlantis, are expecting a 9 percent decline next year, despite some planned in-fill drilling.
ExxonMobil aren’t a big player in the Gulf but have spudded a wildcat, Antrim, in the Green Canyon area. I haven’t seen data but get the impression they are having a higher exploration success rate than most, maybe because they are ultra conservative or maybe they have better technology – they’ve certainly invested a lot into modelling an visualisation.
Reserve Evolution
BOEM issue a yearly update on reserves that includes the estimate for current numbers and revisions to the original estimates for each field. It is part of BOEM’s remit that they develop these estimates independently, but they use the same SEC/SPE methods as the E&Ps. The data comes out in December for the previous year, so 2015 data is the latest available. The way that BOEM hold everything based on leases, and each lease is associated with a single field, makes some of the adjustments a bit ambiguous – e.g. a new field found in a lease will go against the main field name and would look like growth (and presumably the opposite is possible though less likely: a small field that was thought to be commercial is written off and looks like negative growth on the main field).
The charts for oil and gas below are turned on their side compared to normal reserve curves. Usually the curves show original reserves against their year of discovery and any changes in the understanding of what was actually discovered, or in expected recovery (i.e. ‘growth’) is backdated, so all the points on the curves can move up and down each year as they are updated, but they always increase from one year to the next along the x-axis. The curves below show how the estimates of original reserves have evolved, they don’t change (only get added to for each new year), and they can decline from year to year. The more common sort of curve would be a taken from the right-hand axis, with the backdated reserve numbers being where each year’s reserve wedge intersects the axis. I’ve split them as pre-1975, which is all in shallow water (the first deep discovery, Cognac, was in 1975) and lumped together; and post-1975, which are mostly deep water, and are split up by discovery year. There have been about 1.1 Gb C&C and 4.5 Gboe of gas added from shallow fields since 1975, though 85 percent of this was before 1985.
Despite the lease issue I think the growth trends come out as reasonably indicative of what’s going on. For C&C there was growth in reserves up to about 2002 from discoveries, but also from a big reserve growth in old, operating shallow fields. Shallow fields were discovered as far back as the 40s to 60s, and developed with fairly ad hoc methods. Therefore, the growth in the shallow reserves comes from three main sources, all of which are probably related to availability of better technology (seismic, drilling, fluid analysis, reservoir modeling): 1) better understanding of the oil in place meaning accurate, rather than conservative, estimates can be made); 2) higher recovery rates on what is there; and 3) some new shallow field discoveries or new development of technically difficult old discoveries.
Similar growth has been seen on the old US and Middle Eastern conventional fields, although there isn’t really a way to predict how much growth can be expected from each field.

(Click to enlarge)
Since 2002 there hasn’t been much overall growth with one particularly notable exception. In fact, some of the deep-water fields discovered up to then have shown some significant negative growth. There have been some, generally small, discoveries, but for those found before 2008 the reserves mostly had to be taken off the books following the rule changes requiring that reserves only apply on operating fields or those with definite development plans. These are now gradually being added again as projects reach FID and now make up the bulk of recent growth, exceeding additions form newer discoveries.
(Click to enlarge)
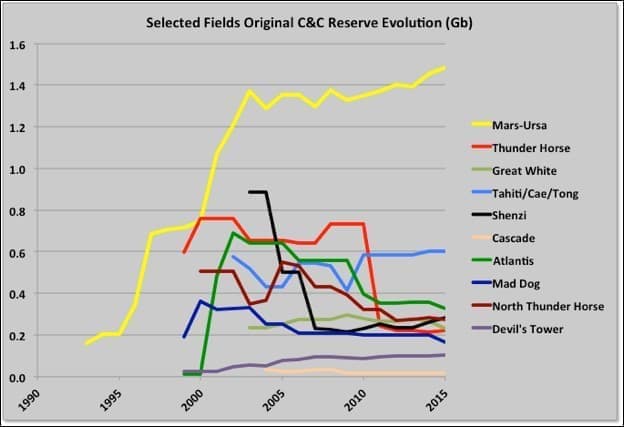
The largest field is Mars-Ursa, and this has shown significant growth, though much is really new discoveries rather than moving “possible” to “probable and proven” categories from the original discovery estimates. The original field, Mars, was discovered in 1989 with Ursa and Princess in 1991, and Deimos discovered in 2002 (all at different depths, and processed through two platforms: Mars and Ursa). More recently two smaller fields – West Boreas and South Deimos, discovered in 2009 and 2010 respectively, were started up via a new platform, Olympus TLP, which was added to develop these and other parts of the leases. All these fields’ reserves go against the 1989 discovery. Notwithstanding that, however, I also think there has been some significant increase in recovery rate through improved water injection strategy and well design, which would be genuine “reserve growth”. Note that two other fields, Crosby and Europa are developed through the Mars platforms but are reported as separate leases with their own reserve numbers. Related: The 'Mega' Oil Field That Will Never Boom
Against this some of the other large, deep fields have had significant write downs of their initial reserve estimates, notably the BP fields of Thunder Horse, Mad Dog and Atlantis, but also the BHP operated Shenzi field which lost over 70 percent of its original reserve estimate. Thunder Horse, Atlantis and Mad Dog all have extensive brownfield work just completed or in development so some of these reserve downgrades may reappear, though it’s not clear if they should count as growth or new discoveries.
I’ve shown some other fields as more representative of how the deep fields have behaved: Tahiti/Caesar/Tonga is a field split between two operators and has been up and down but overall has grown, and might again when the 2016 and 2017 figures come out as there has been a lot of brownfield work there; Great White has declined slightly overall (especially in 2015 which might be price related); Cascade is a small field that has been pretty disappointing and dropped almost 60 percent from its original estimate; and Devil’s Tower looks like it has grown significantly for oil, but initially it was producing from three gas fields and subsequently Kodiak, an oil field discovered in 2008, has been added (from what I can see Kodiak production looks pretty disappointing and it is currently cycled, so a reserve downgrade might be on the cards).

(Click to enlarge)
Natural gas is similar to C&C in that there was large growth in the operating shallow fields as new technology become available in the 80s; deep water field discoveries added notable reserves were until about 2002 but then petered out (most of the gas is associated so no surprise there) and no discernable growth in the original estimates on any years except maybe for Maars-Ursa from 1989.
By George Kaplan via Peak Oil Barrel
More Top Reads From Oilprice.com:
- Is The EIA Overestimating The U.S. Shale Boom?
- China Set To Become More Dependent On Oil Imports
- The Drastic Drop Off In U.S. Oil Imports


