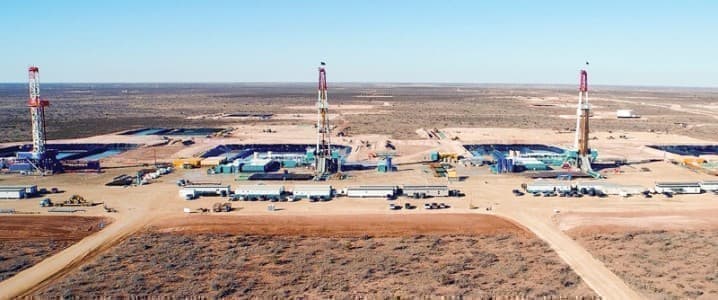
As the oil price dropped through the first and second quarters of this year, oil companies closed in wells and laid off drilling and fracking crews. Activity bottomed in late May and has mounted a steady recovery in the months since. Rig count increases have been moderate, rising from low of 251 in May to 269 as of the 5th of October. What has been more spectacular is the increase in the deployment of frac crews as operators have allocated capex to bring Drilled by Uncompleted, (DUCs) out of inventory and into production. The graph above shows the true impact of this trend, with frac crews more than doubling since May’s lows.
The question before us now, is what can we expect through the rest of the year and on into 2021?
In a recent OilPrice article I documented a relevant industry consolidation move by Schlumberger, (NYSE:SLB) and Liberty Oilfield Services, NYSE:LBRT). I’ll let you follow the link provided for relevant details on the joint venture between these two companies. For a quick reference this creates the largest player in U.S. shale fracking with an estimated twenty percent of the available hydraulic horsepower, HHP in the industry today.
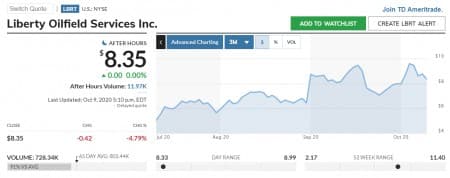
In this article we are going to concentrate on some broader industry trends and I will have an updated recommendation for shares of LBRT as well. I was cautious on LBRT immediately after this merger as the share rocketed 40% higher in a single day. That move wasn’t something I wanted to chase. As the chart below indicates this caution was well advised as the stock sold off over the next few weeks, before regaining most of its early value. Over the last week the market action has taken the general oilfield lower, and now we think that LBRT represents a compelling value at current prices.
The future of shale
Shale production has bounced higher with the DUC withdrawal of the last few months and is currently at 8 mm BOPD according to the most recent issue of the EIA’s 914. This is about 2.5-million BOPD higher than I had thought we would see earlier this year when in an OilPrice article I estimated that shale would exit 2020 around 5-6 mm BOPD. There is some noise in the data and the EIA 914 only has data through July.
Two things are clear from this data though. First, it is clear that DUCs are contributing new oil at a rate higher than the simple arithmetical average the EIA takes with the rig count divided by monthly production numbers. Second, this can’t be maintained. At some point the disparity between the frac count and the rig count will cause a sharp decline in shale production. I wasn’t wrong with the 5-6 mm BOPD estimate for shale production, just off on the timeline.
Related: The Next Couple Of Months Are Crucial For U.S. Oil
There is also another reason why the decline of U.S. shale will steepen. Up to now we have feasted on production from the very best acreage in shale plays. Referred to as Tier I, wells drilled in this rock are the most productive from a cost to drill, estimate of ultimate recovery-EUR, quality of hydrocarbons present-oil vs gas, and some other lesser factors. Henceforth oil companies are going to be forced to bring in wells from Tier II, and III, and these will simply not be as prolific as Tier I. This isn’t something technology-more sand per foot of interval, well spacing, 4D fracking, etc. can fix. This is just a physical reality.
A different way of looking at the data
Recently I ran across an article by Leen Weijers, Vice President of Engineering at Liberty. I am a data freak and am always looking at new ways of visualizing trends and raw data, and think perhaps we rely too much on the EIA simply because no one else puts out this kind of data, for free anyway. This article drew my eye as it correlated declining frac crew efficiency with the need for more crews to maintain production. Some of this is intuitive but it took an insider like Leen to crunch the numbers.
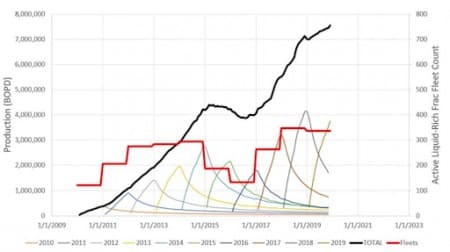
Source This graph depicts the increase in production vs the number of frac fleets over time.
Things get interesting in the next graph as it takes that data and applies a yearly focus to it. You can see that production rises from 2009, the year most people would say the “shale revolution” started, to the present day. Going from 1,500 BOPD in 2009 to over 12,000 BOPD in 2017. It also shows that since 2017 the rate of productivity per fleet has plateaued, or started a slight decline.
To what can we attribute this plateau, in spite of massive increases in frac stages pumped, optimizing well spacing, 4D fracking, and tons of sand placed into the reservoir per frac crew employee increasing by a factor of 12 over this period?
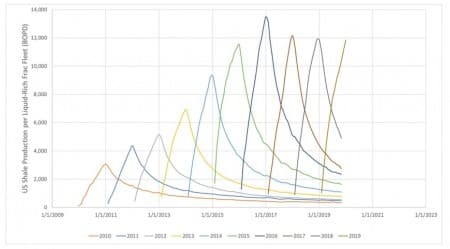
Leen draws a conclusion in the article-
“The reason for the production plateau since then is that frac crew efficiencies have been balanced by lower US well productivity from infill drilling and a slow but gradual move to lower reservoir quality.”
He next postulates from the previous data that to maintain an annual production rate for shale of about 5.5 mm BOPD, it would take an average of liquid-rich 165 fleets operating in 2021, working alongside another 30-40 gas rich fleets. This is about 2-mm BOPD below present levels and approaches the estimate I generated a few months back, giving it some additional validation.
To increase production by a million BOPD Leen estimates it would take the addition of another 85 liquids-rich fleets, for a total of ~250 active frac fleets. An increase that would more than double present activity as documented in the Primary Vision data.
Related: Middle East Natural Gas Megaprojects Face Major Risks
This is certainly doable as the trend for May through September added about 20 new fleets per month. We could hit the low estimate of 200 by February, 2021 and the higher one by May.
The fly in the ointment would be the requirement that operators do something they have almost universally sworn they would not do-increase capex to boost production. What could affect this change in mindset? We will circle back to this thought as we close out the article.
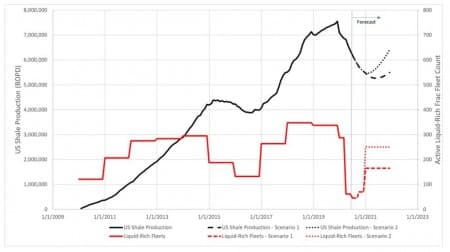
To summarize this section, it appears that shale production will begin a decline from present levels in any scenario modeled by Leen. This will be driven by lower overall activity and a decline in reservoir quality from Tier I to the lower productivity horizons for Tiers II and III.
The thesis for Liberty Oilfield Services
This brings us back to the thesis for Liberty as an investment. The company through cost slashing and headcount reductions managed to generate free cash on reduced revenues in Q-2. LBRT ended the quarter with $125 mm in cash, $106 mm in long term debt, and total liquidity including their ABL of $207 mm. Their active frac fleets were cut to 12 and about the same was projected for the rest of the year. That did not give up much of a reason to tie up money in LBRT.
And then Schlumberger gave LBRT all of its frac gear in an asset merger in exchange for a 37% in the new LBRT. No money changed hands, and no new debt was created. In a single stroke the landscape of fracking services changed forever.
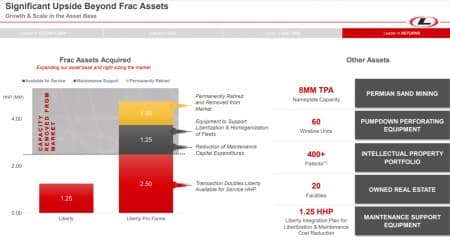
Liberty reports $12 K EBIDTA per fleet for 2019, and claims a 22% market share. If we use those numbers that would put about ~9-10 fleets working as of May. The growth in the market since May should put them at ~25-30 fleets working, or doubling of activity for the company since then.
My expectation is that when LBRT reports it will announce substantially increased revenue and profit for Q-3, and cautiously higher guidance. With an EV/EBIDTA of 10.2 as of today the stock does not yet reflect this anticipated improvement.
Of the 16 analysts who cover the company, eight-have a buy rating, one- has an outperform, and 7-rate the stock as a hold. The median estimate for LBRT is to hit $9.63 per share over the next year, a boost of 15% from present levels. The most optimistic has it at $12.50 by YE 2021.
My thoughts are that the landscape for oilfield services will improve in 2021, led by a drop in U.S. production and increased demand from a recovery economy. LBRT could be a good way to play this recovery.
By David Messler for Oilprice.com
More Top Reads From Oilprice.com:
- What Is Slowing The Oil Market Recovery?
- Libya Restarts Oil Production At Its Largest Oilfield
- The World’s First Fully Driverless Vehicle Ready To Hit The Roads


