The market is gradually beginning to give credence to something I've been discussing in past OilPrice articles for a long time now. In a June, 2020 article entitled, Underinvestment Could Send Oil Prices Soaring, I argued how the retrenchment and lack of capital investment the industry has seen the past five-years would lead to shortages of crude eventually. The huge volume of Saudi overproduction exacerbated the equal largess in American shale for the past couple of years, and led to a glut of crude globally. 
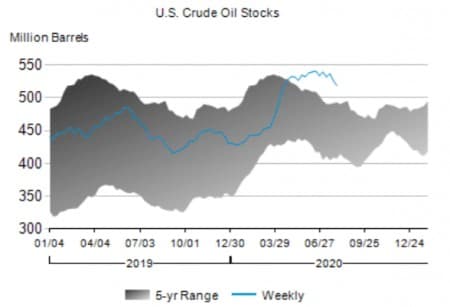
EIA-WPSR The blue line shows weekly storage numbers beginning to edge back into the five-year range.
We are now starting to work off this glut as noted in the weekly EIA petroleum status report above, and the day of reckoning I forecast in June is just around the corner, a few months hence at most. Even the news in July that OPEC+ would start restoring as much as two-million BOPD through the end of the year, failed to quiet the unease beginning to take hold in the market. News like that would have sent prices into the cellar in May, having left the current contracts above $41 for WTI and near $45 for Brent.
Take the two bullets below to the bank.
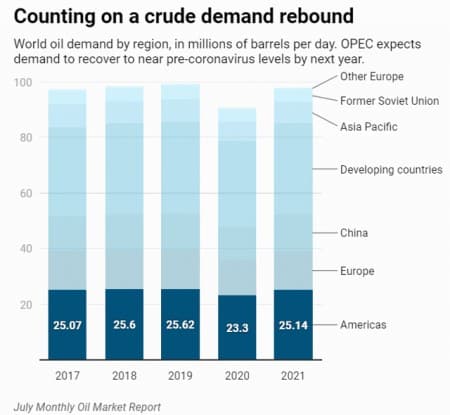
- Supplies of crude oil are going to drop, just as demand is on the increase.
- Oil prices are going to continue advancing higher.
In the rest of this article we will give a forecast of where we see end-of-year U.S. daily production and the impact that will have on prices for the two most closely followed benchmarks, WTI, and Brent.
The Permian
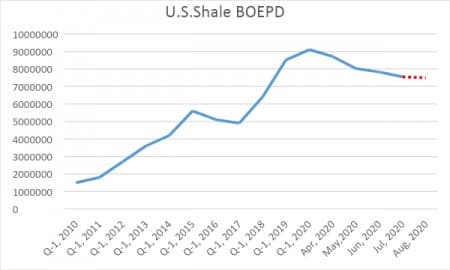
Focusing on the Permian as it alone accounts for over half of U.S. daily shale production, let’s note the slope of the decline that began in March, and accelerated in April.

Obviously, the dramatic drop in production from April to May was primarily a product of the shut-in campaign producers waged to try and lever prices higher. A campaign we'd have to call a success, as prices have risen from $12.34 to over $42 since April, 28th.
Related: Alberta Missed Its Chance To Mint A Province Of Oil Millionaires
June's 914 will probably show a moderation or even an increase as producers started to bring production back mid-month in June, and continued on into July as prices ramped. I think that will probably be it and production will start a sharp decline through the end of the year. I stick to my prediction of a shift in mentality from, "I can get all of the oil I want all of the time," to, "Where is my next load of oil coming from." That's my feeling for the start of Q-1, 2021.
Key Bullish indicators for oil prices
Drilling- no question, the continued decline in drilling in the USA has sealed the fate for shale, which is bullish factor number 1 for oil prices. Shale production has peaked and we will never again see shale production of over 9 mm BOPD. For the week ending Aug-7th the Baker Hughes rig count dropped slightly versus the week prior, continuing a five-month, largely uninterrupted trend down.
What does this profound decline in drilling portend? From January to now we've lost ~550 rigs. At an average of 800 BOPD per rig that's 440K of new production we haven't seen. Legacy decline amounts to about 300K BOPD through May. Those two numbers together come to roughly 750K BOPD. With only 246 rigs adding to new production there is a gap of ~500K BOPD from drilling activity YoY alone. The problem of the high legacy decline will only accelerate as this year closes out, and 2021 dawns.

Russia- The outlier in the OPEC+ duopoly reported that its production had fallen 16% YoY. This suggests that it has been following its commitment in the current OPEC+ production cut. Cuts that are now being gradually restored. There had been a good bit of rumbling about whether Russia was sticking to this agreement. News that is has is bullish for the oil market.
Libya - Years of political strife have wrought a toll on this OPEC producer. OPEC's Monthly Production report paints a gloomy picture with their production dropping from 1.1 mm BOPD last fall to 82K as of June. A lot of this loss is probably permanent as equipment is not being maintained, reservoirs are being damaged from water influx, etc.
Venezuela - Oil production in this nearly-failed state has fallen to around 375K BOPD as of the end of June. In the last 20 years this country's oil production has dropped from ~3.5 mm BOPD to present levels. This situation is unlikely to resolve itself favorably in the upward direction anytime soon as the very last rig still drilling in the Orinoco has been laid down, as per this Forbes Article.
OPEC+ - Sensing that their gambit to raise prices has been at least partially successful, has begun to restore production. This metric while not bullish in and of itself, is notable in the manner that this shut-in production will come back. With an eye toward gradually increasing oil demand for the rest of this year, OPEC+ will gradually add back about 2-mm BOPD through year-end. With ~5-months left to go this amounts to about 400K BOPD per month. This is helping to sustain the oil price rise as demand growth will easily absorb this amount.

The Economy - The bullishness that overcame the market in June, and began to dissipate in July put a top on oil prices. Inventory builds that occurred then sent ambiguous signals into the market. As we go into August, what's becoming increasingly clear is we are adapting to this new reality faster than anyone thought possible. While the V shaped recovery is off the menu, we are recovering in terms of employment and overall business activity. Last the Wall Street Journal reported that 1.5 mm new jobs were added in July, dropping the unemployment rate to 10.6% of the working population.
Related: Are Oil Majors Giving Up On Guyana?
Key OFS - Companies are raising hopes for the future, as noted by Halliburton's CEO in their quarterly conference call, “a gradual recovery was underway." A sentiment that was present in a number of conference calls for the second quarter.
Covid-19 - The good news here tends to be lost in the higher infection rate noise of Q-2. The real story is that the mortality rate is much less than initially thought, and the really good news is that relief-real relief is in sight. I am talking of course about vaccine trials, as noted in a recent Wall Street Journal article. The news here is unreservedly bullish.
Stimulus - The government basically fulfilled its function of stepping in in a number of ways to provide the trillions of dollars of stimulus and liquidity the market has demanded earlier this year. In my opinion more of this is needed, and I hope our political leaders can come together to provide it. There's a narrative about the amount of new debt that's been created. This narrative loses sight of the depth of decline small business has seen compared to bigger companies. A new PPP program is absolutely needed to avoid a severe recession. There is no doubt in my mind, the government will again shore up the economy with a program similar to the one prior. President Trump’s recent Executive Orders are a good start. More will come.
The Key Bearish indicator
China- Demand from China has been one of the things that's helped to take excess oil off the market. Unofficial estimates made in a Reuters article suggest that China was responsible for about 3-mm BOPD of purchases in excess of their internal demand. Doing this while oil was really cheap to keep their costs low. Now that oil has doubled from March lows, there is a narrative these purchases may slow. The market can certainly absorb some oil in addition to what OPEC+ will be restoring, but how much is the question. Associated with that is the amount of floating oil stored in ports on tankers. Another recent Reuters article estimated that there were as many as 120 mm bbls waiting to be offloaded in Chinese ports.
Outliers
What could change the dynamic one way or the other is the lack of belligerence in the world currently. That could change at any time, and is impossible to predict. There is no war premium in oil currently.
Iran which people have been saying was going to implode at any moment for the past year, still defies sanctions on its nuclear industry. My view is that while the world has been occupied for most of this year with Covid-19, as this begins to abate there will be renewed pressure on Iran. A war premium would add $50 a bbl to the oil price over-night.
In a move to re-nationalize its oil reserves, Mexico seems to be moving to drive out foreign investment in coming years, reversing a previous trend toward welcoming foreign capital. This as their production has entered a gradual production decline from 2.3 mm BOPD to about 1.75 mm BOPD during the last five years.
Oil companies are becoming leery of deploying capital in marginal areas, as noted by the huge asset valuation write-downs taken by all of the Super Major oil companies in the first half of this year. Any notion that their capital is going to be subjected to an eventual heavier tax regime, or outright nationalization, will send them into hibernation.
Your takeaway
Overall, the case for oil supplies and production rates continuing to diminish and for prices to continue to rise, is stronger than the inverse scenario. We expect year-end U.S. domestic shale production to be in the neighborhood of 5-mm BOPD. This represents a YoY decline of about 45%. This stark view is not widely held by the market, notably with the EIA-STEO forecasting the decline to be only about 2-mm BOPD. That’s the problem with forecasting- you never have enough data.
Here’s what we know. In January of 2020 with 805 rigs running U.S. shale production peaked at 9.3 mm BOPD. A moderate decline rate of 50% (annual shale decline rates vary from 30% for great, Tier I acreage wells, to as high as 70% YoY for lower tiers or poorly completed wells.), for legacy decline from the first of the year would see production halved.

EIA-Drilling Productivity Report
If 2020 averages 435 rigs per day, that’s ~350K BOPD new production from drilling for the year. In that scenario we add that new oil to what’s left after legacy decline, ~4.6 mm BOPD, and we get ~5-mm BOPD.
Numbers don’t lie. This is admittedly simple math for an incredibly complex actual-almost incalculable calculation, but if I am even close to being right, and storage truly does get worked off around the world…get ready for $100 oil.
By David Messler for Oilprice.com
More Top Reads From Oilprice.com:
- Microsoft And Halliburton Are Building The Oilfield Of The Future
- Oil Prices In Limbo As Fears Of A Second COVID Wave Grow
- Is The Bottom Finally In Sight For U.S. Drilling Rigs?


