


EIA reserve estimates for USA for 2016 have been issued (a couple of months later than usual). The numbers they provide are ‘proven’ reserves of crude, condensate and natural gas.

(Click to enlarge)
The data is provided directly by the E&Ps with some adjustments made by EIA for missing numbers. The data show reserves for the end of a given year, plus the reasons for change over the year: basically discoveries, production, revisions and sales. Until 2015 EIA had different categories for discovery (essentially a new reservoir, although there may be new pockets in existing reservoir) and extension (an increase in the area of an existing field). Recently most of this category has been extensions to LTO fields (i.e. an increase in the expected economic drainage area of a play). This year the reporting has changed so all discoveries and extensions are reported as a single figure and I’ve shown only this sum for previous years too. I have summed revision gains and losses plus adjustments to give a net number, and similarly for sales and acquisitions.
This year the data include non-producing reserves. I don’t know for sure if this is new, but I haven’t noticed it before and can’t find any history for previous years. ‘Non-producing’ may mean reserves behind wells that are offline (e.g. are uncompleted, for maintenance or because of lack of processing or transport capacity); or that have real development plans for their production (typically starting within the next five years according to SEC rules, although for large, long cycle conventional projects the time can be extended). The undeveloped values for 2016 are shown on each chart.
‘Probable’ reserves are not included but I think this contribution might now be a relatively small proportion overall. The conventional oil reserves are in mature fields and these tend to have decreasing proportion of probable as they age – see below for the GoM, where BOEM 2P numbers are actually lower than EIA 1P estimates. For LTO there are few new fields each year and production growth comes from incremental development of known fields. In theory the expected recovery should be fairly well known but there are some really large revisions both up and down each year, which might indicate the E&Ps don’t have much idea, so setting reserves as proven versus probable maybe isn’t very meaningful.
The discussion here covers mostly crude for the USA, the GoM and the main tight oil plays, plus some look at natural gas overall and in the GoM. For some of the shale plays I have made some high-level guesses about future well numbers, which I’ve based on figures from Enno Peter’s excellent shaleprofile blog.
USA Total Oil
Total proven oil reserves for U.S. in 2016 rose slightly: production was about equal to discoveries and extensions plus small net increases from acquisitions and revisions (see chart above). Although the overall net revision was small both the total increases and decreases exceeded 5 Gb, which is high relative to total reserves, for decreases this is the second highest number after last year and is likely to be a reflection of the uncertainties associated with tight oil plays as there is no history for any being run through a full life cycle. In fact, the two revision numbers were almost equal, and the change came from ‘adjustments’, which is a catch-all category used to make the numbers balance and might well just be a rounding error. The average price of oil fell in 2016 compared to 2015, which likely had an impact on some marginal areas.
Discoveries and extensions were about equal to 2015 and well down on 2013, which looks like the peak of a bell curve for tight oil growth that started in 2005. If so then it should drop down now through 2021, although possibly extended a year or so because the price crash in 2015 looks to have had a significant effect.
I have shown condensate for total reserves, though not the yearly adjustments, which for some reason EIA don’t give in the same format, by region, as they do for crude (neither do they do it for natural gas or NGL). Condensate reserves have been growing significantly because of shale gas but fell slightly this year.
Global conventional oil discoveries dropped to a new record low in 2015 and again in 2016. Combined with the USA tight oil numbers the drop is even more pronounced. Conventional oil saw another small drop in 2017 and that looks the most likely course for tight oil too, given the recent trend.
Non-producing reserves are shown as the green diamond and are just over a third of the total, and this a common proportion across different plays and for oil or gas. For conventional plays these would usually represent non-developed fields, but for tight oil are mostly non-drilled areas or non-completed wells in known and partially developed fields.
Crude production fell in 2016 but picked up again in 2017, which will be reflected in this year’s release that is due again in November.
Gulf of Mexico Oil
For GoM crude production is increasing through 2016, but discoveries are low and hence depletion and decline rates are high. I have included condensate reserves, but the production and adjustment figures are for crude only. Condensate production has been declining with natural gas (see below) and is now relatively insignificant. I don’t know where the big revision upgrade for 2016 came from but could be the Appomattox project, which was approved for construction, or the BP extensions to the Atlantis field. However, there were significant numbers for reserve decreases exceeded by larger increases, so overall several fields have been affected.
The EIA 1P and BOEM 2P numbers are converging, the difference is probably mostly to do with which undeveloped reserves are included. The EIA non-producing reserve is about 1.4 Gb, a large part of which is in Appomattox, and probably Mad Dog. The producing reserves, at around 3.6 Gb, imply average 15 to 20 percent depletion rates in the on-line fields at current production rates.

(Click to enlarge)
Main Light Tight Reserves
Eagle Ford
Discoveries and extensions increased slightly in 2016 compared to 2015 but are well down on the peak year of 2012. Eagle Ford has a lot of condensate production and extends over a large area including some conventional oil, so there may be a couple of logistic curves overlaying each other for the discoveries. This year the production seems to have started a slow decline and that looks about in-line with the discovery pattern. Price changes may have had some impact as well, but maybe less than would have been seen for conventional plays or in a normal interest rate environment.
Non-producing reserves, which would include DUCs, anything off-line for maintenance or because of lack of transport capacity and any areas with clear development plans, are 2.1 Gb. At 150 kbbls EUR per well that would require 14,000 wells to be completed, or 2,800 per year if they are to be developed within the five-year SEC limit, which is about double this year’s number. Recently the EUR seems to be falling for new wells, which might suggest the core area is being exhausted, if so more wells would be required: something doesn’t quite add up.

(Click to enlarge)
Bakken
Discoveries and extensions show a pretty good bell curve and seem likely to drop down fairly low over the next couple of years. The shape of the LTO discovery curves for different areas look somewhat similar but with the life cycle proportional to the total reserve. There have been fewer than ten Bakken wildcat discoveries reported over the last three years, so the growth must come from extensions of existing fields, which should be fairly well known now and with declining potential for further increases. A higher price may encourage more exploration and discoveries but most recent wildcats outside the core areas have come in dry.
Related: U.S. Crude Exports Hit A Major Milestone
Undeveloped reserves are 2.5 Gb, which at 400 kbbls EUR per well (from Enno Peter’s data) would be 6,250 wells. I don’t think there is enough acreage in the core area to support that (by maybe 3,000 wells short from December 2016), but outside that area the EUR would drop, and many more wells would be required. Last year 1071 wells were spudded, a few more completed, so it might just be possible to develop those reserves within five years as required by SEC reporting rules, but I think they’d have to get a move on, and the E&Ps definitely don’t appear to be erring on the conservative side for their estimates.
There is a tiny part of the Bakken in South Dakota, but I haven’t included that.
(Click to enlarge)
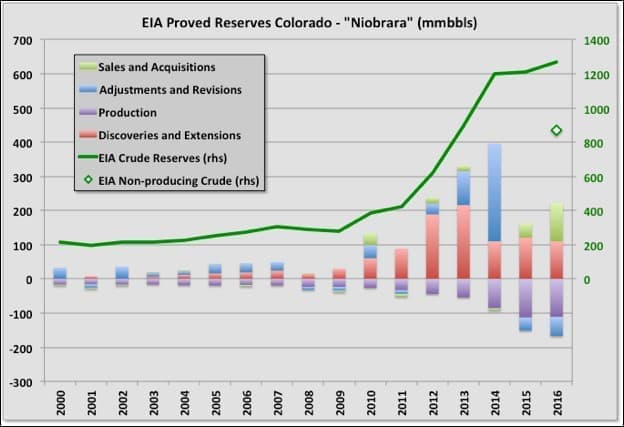
Niobrara
Niobrara reserves increased, mainly due to acquisitions. I’m not clear exactly how acquisitions can exceed sales so significantly, but it could be the E&Ps purchased land with resources that hadn’t previously been considered for development. Like Eagle Ford and Bakken, the discoveries and extensions look likely to be trending significantly lower over the next couple of years, but there is a high proportion of undeveloped reserve that could allow a production increase or extended plateau.
(Click to enlarge)
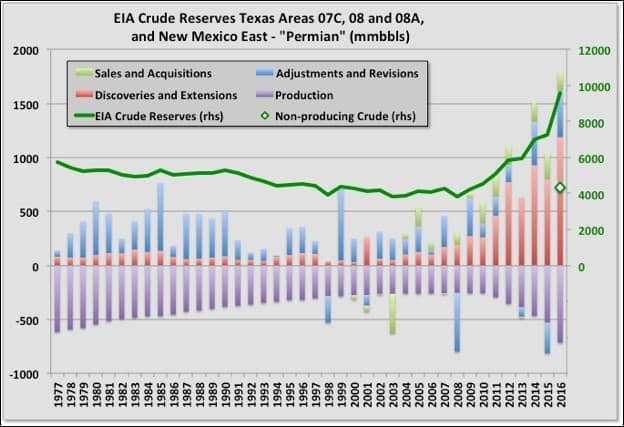
Permian
The Permian is where most of the reserve growth has occurred, in fact over half the total. The chart shows the gradual decline in conventional oil from 1979, which presumably is still continuing, and then the sudden growth in reserves and production since 2008 from LTO. I don’t understand how there can be significant acquisitions over sales every year, but there it is. The reserves for 2016 are almost a third of the total for US, and likely grew further in 2017. Similarly, non-producing reserves are the largest of all areas, and too are almost a third of the US total at 4.3 Gb. It’s difficult to see what the likely average EUR for Permian tight oil, horizontal wells will be as all the wells are fairly young, but 400 to 500 kbpd seems on the cards. So that would represent be about 10,000 wells worth or 2,000 a year to meet a five year development schedule, which is about what was achieved in 2017. Therefore continued, increasing production looks likely and the repeated highlighting of the Permian as a key component of many E&Ps near term plans is understandable.

(Click to enlarge)
Estimated Ultimate Recovery
I fitted Verhulst equations to each of the four areas’ original discovery values. This allows estimates for the ultimate recoveries to be made as they are the areas under the curves, as shown. Note these estimates are just the conclusions from curve fitting based on the E&P stated numbers, they do not imply I think that is what will be achieved. The numbers need to be treated with a lot of caution, but the great thing in writing for a blog is you can speculate without complete scientific rigour. One problem is that revisions aren’t included – to be meaningful these would have to be backdated against the original discovery years, and that data isn’t available. In addition, some of these, particularly the Permian, have more than one play involved and should be represented by a matching number of independent curves, but I don’t have the data to do that either. For the Permian especially, there isn’t really enough data to fit a good curve (most of it is extrapolation): a small drop in discoveries for 2017 would more than halve the EUR for the newly fitted curve.

(Click to enlarge)
For Bakken, Eagle Ford and Niobrara I also fitted a Verhulst equation to production numbers and hence provide an estimate for future trajectory. I didn’t do this for the Permian as the error bars would swamp all other numbers, but the picture their might be clearer next year. The total production for the Verhulst curves (i.e. for post 2006 developments) is equal to the total EUR predicted from the discovery curve fitting plus any net revisions and acquisitions for the period 2006 to 2016. I assumed that reserves before 2006 would decline exponentially at the same rate as 2006. The fits are pretty good, but then there aren’t really many points to match, interestingly though all three plays break down in the same way with 2015 higher than expected and 2016 lower. It remains to be seen whether this is an artefact of changing policies in response to falling prices, or inaccurate reserve numbers, or maybe just that Verhulst isn’t the best choice. I’ve included preliminary 2017 values but didn’t use these in the curve fit (and should emphasise again that, especially for Eagle Ford, the production isn’t from a single play or necessarily all non-conventional oil). By this method it looks like the three regions are at or around their peaks, with an overall slow decline to come.

(Click to enlarge)
Ernst and Young
E&Y make their own estimates for U.S. reserves for the fifty largest E&Ps. It’s main advantage is that it comes out in June, well before the EIA numbers. They also include condensate and NGLs. As shown below nothing they presented seems to be at odds with the EIA numbers, although they do show a slight decline for 2016 rather than a small uptick.
Most of the discoveries come from these largest companies (the condensate and NGL have some impact but it looks like the smaller companies had very low discovery rates), but there is less growth from net acquisitions (i.e. purchases minus sales) than I would have expected, e.g. compared to 2014, so maybe the smaller companies had decided to ride out the low price years or maybe they had nothing that the larger companies considered worth going further into debt to buy. E&Y break out revisions for IOR as a separate category and the numbers indicate this isn’t contributing much, for all the technology improvements, and is declining.

(Click to enlarge)
Natural Gas
I’ve only looked at total US gas and the GoM. Data for individual areas is available but it takes a lot more effort to download and sort by area than for crude oil.
Related: Brazil’s Coming Oil Boom Will Weigh On Oil Prices
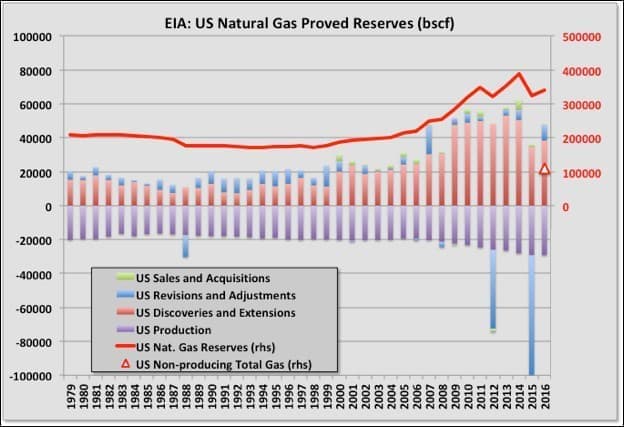
Total USA Natural Gas
Reserves dropped significantly in 2015 but rose slightly in 2016 to 341 Tcf (about 57 Gboe). Non-producing reserves are about a third of the total at 110 Tcf (18 Gboe). However, discovery rates are in slight decline and may have peaked in 2013. Discoveries rose rapidly from 2007 because of the shale plays and if a something like a normal bell curve is followed may decline equally rapidly now. Production shows signs of starting to plateau over the last three years; it will be interesting to see how things evolve if prices start to rise or LNG exports quickly expand.
(Click to enlarge)
Gulf of Mexico Natural Gas
The Gulf of Mexico is at the end of its life as a significant gas producing area. The last major producing gas field is Hadrian South, which started up in early 2015 and had been supplying just over 10 percent of total gas but came off plateau last July and has declined rapidly. Most of the remaining gas is associated with oil and there isn’t much undeveloped reserve remaining.

(Click to enlarge)
By George Kaplan
More Top Reads From Oilprice.com:
- What’s Really Happening With Venezuela’s “El Petro?”
- Oil Prices Rise After EIA Reports Crude Draw
- Rig Count Inches Higher As Oil Prices Stabilize


BP’s calculation of proven reserves is misleading. BP includes in its calculations of reserves NGLs which come from natural gas wells as well as such gases as ethane, propane, butane and pentanes which don’t qualify as crude oil and condensates in its crude oil count. The real question is whether natural gas plant liquids can be sold as oil on the world market. The answer is a resounding “No”. In fact, major oil exchanges accept neither natural gas plant liquids nor lease condensates as satisfactory delivery for crude oil. And if major exchanges don’t accept natural gas liquids as crude oil, then they are not crude oil or as a well-known Texan oilman, Jeffrey Brown, pointed out:” If what you are selling can’t be sold on the world market as crude oil, then it’s not crude oil”.
Referring to US reserves, there are large uncertainties about the size of US shale oil resources with estimates ranging between 700 bb and 2.00 trillion barrels (tb).
Although no serious attempts have been made yet to assess its size, it seems that even if the oil-initially-in-place (OIIP) volumes are large, reserves will not be as high due to a very low recovery factor (RF) presently in the range of 1-2%. It is one thing having huge resources of shale oil in-place and quite another turning them into proven reserves and sizeable production capacity. The EIA reported that US proven oil reserves (conventional and shale reserves) amounted at the end of 2015 to 36.4 bb.
And with a depletion rate estimated at 70%-90% in the first year of production in a shale oil well, the US shale oil industry needs all the reserves it can get its hand on to remain afloat.
Dr Mamdouh G Salameh
International Oil Economist
Visiting Professor of Energy Economics at ESCP Europe Business School, London