U.S. West Texas Intermediate crude oil surged to the upside on Monday, setting a bullish tone for the week. The catalysts behind the price action were renewed speculative bets on further strength amid the OPEC-led production cuts and a decline in U.S. drilling activity.
The rally continued throughout the week with the futures contract exceeding highs last seen on November 28, 2014, the day after OPEC’s decision to cut production in an effort to trim the excess global supply and stabilize prices. The catalyst behind this move was another weekly decline in crude oil supply.
According to the U.S. Energy Information Administration, U.S. crude inventories fell 4.9 million barrels last week, more than the 3.9-million decline forecast.
Prices continue to rise on Thursday with WTI crude oil rallying to a multi-year high after the United Arab Emirates’ (UAE) oil minister hinted that an alliance between OPEC and non-OPEC producers, including Russia, could continue in some way beyond their current deal to curb oil output.
UAE Energy and Industry Minister Suhail al-Mazrouei told CNBC on Thursday that the OPEC-led plan to cut production is working so it may be extended beyond the December 2018 deadline.
“I am expecting that this group of countries that stood and have become responsible for helping the market to correct, (that) there is a very good chance that they could stick together and put a shape around that alliance,” al-Mazrouei said.
“OPEC will…
U.S. West Texas Intermediate crude oil surged to the upside on Monday, setting a bullish tone for the week. The catalysts behind the price action were renewed speculative bets on further strength amid the OPEC-led production cuts and a decline in U.S. drilling activity.
The rally continued throughout the week with the futures contract exceeding highs last seen on November 28, 2014, the day after OPEC’s decision to cut production in an effort to trim the excess global supply and stabilize prices. The catalyst behind this move was another weekly decline in crude oil supply.
According to the U.S. Energy Information Administration, U.S. crude inventories fell 4.9 million barrels last week, more than the 3.9-million decline forecast.
Prices continue to rise on Thursday with WTI crude oil rallying to a multi-year high after the United Arab Emirates’ (UAE) oil minister hinted that an alliance between OPEC and non-OPEC producers, including Russia, could continue in some way beyond their current deal to curb oil output.
UAE Energy and Industry Minister Suhail al-Mazrouei told CNBC on Thursday that the OPEC-led plan to cut production is working so it may be extended beyond the December 2018 deadline.
“I am expecting that this group of countries that stood and have become responsible for helping the market to correct, (that) there is a very good chance that they could stick together and put a shape around that alliance,” al-Mazrouei said.
“OPEC will continue to be a strong organization and I think this phenomena of getting others to join OPEC in their cause of market recovery, and achieving enough to incentivize investments into this industry, is something in which interest is growing,” he said.
The week is ending with WTI futures under pressure. Looking at the daily chart and the markets excessive reaction to the UAE oil minister’s comments, I have to conclude that we may have seen a short-term blow-off top. The hedge funds have been quite active in the markets, buying strength rather than dips, but I think they may have overextended themselves on Thursday with the spike to the upside.
I think crude oil is officially overbought on the daily chart based on Friday’s price action and I wouldn’t be surprised if we see our first short-term correction for the new year next week.
Technical Analysis
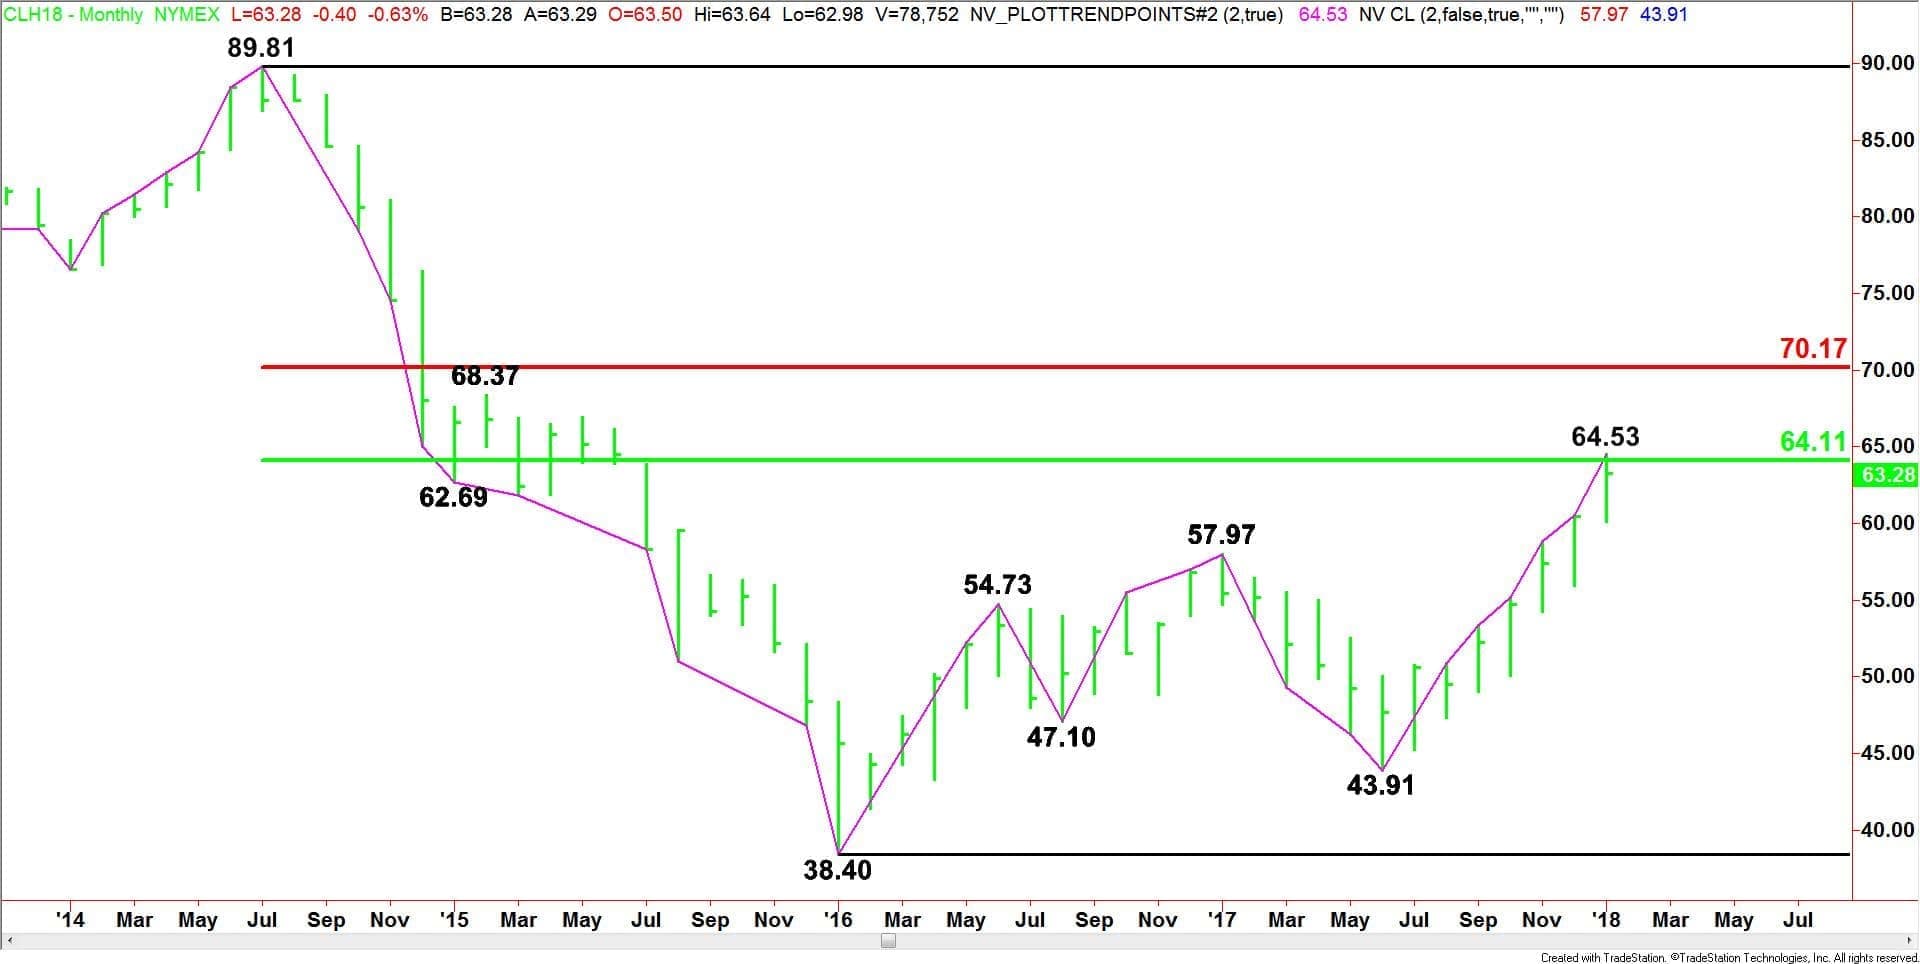
Monthly March West Texas Intermediate Crude Oil

(Click to enlarge)
The main trend is up according to the monthly swing chart. The main trend turned up in November 2017 when buyers took out the $57.97 main top.
The main range is $89.81 to $38.40. This month, we reached the 50% level of this range at $64.11. This is a natural selling area so we may see a short-term pullback from this level, but I don’t see a change in trend coming.
Overcoming $64.11 and sustaining the move will put the crude oil market in a position to challenge the 61.8% or Fibonacci level at $70.17. As you can see from the monthly chart, there is plenty of room to the upside over $70.17 so taking out this level with strong volume could trigger an acceleration to the upside.
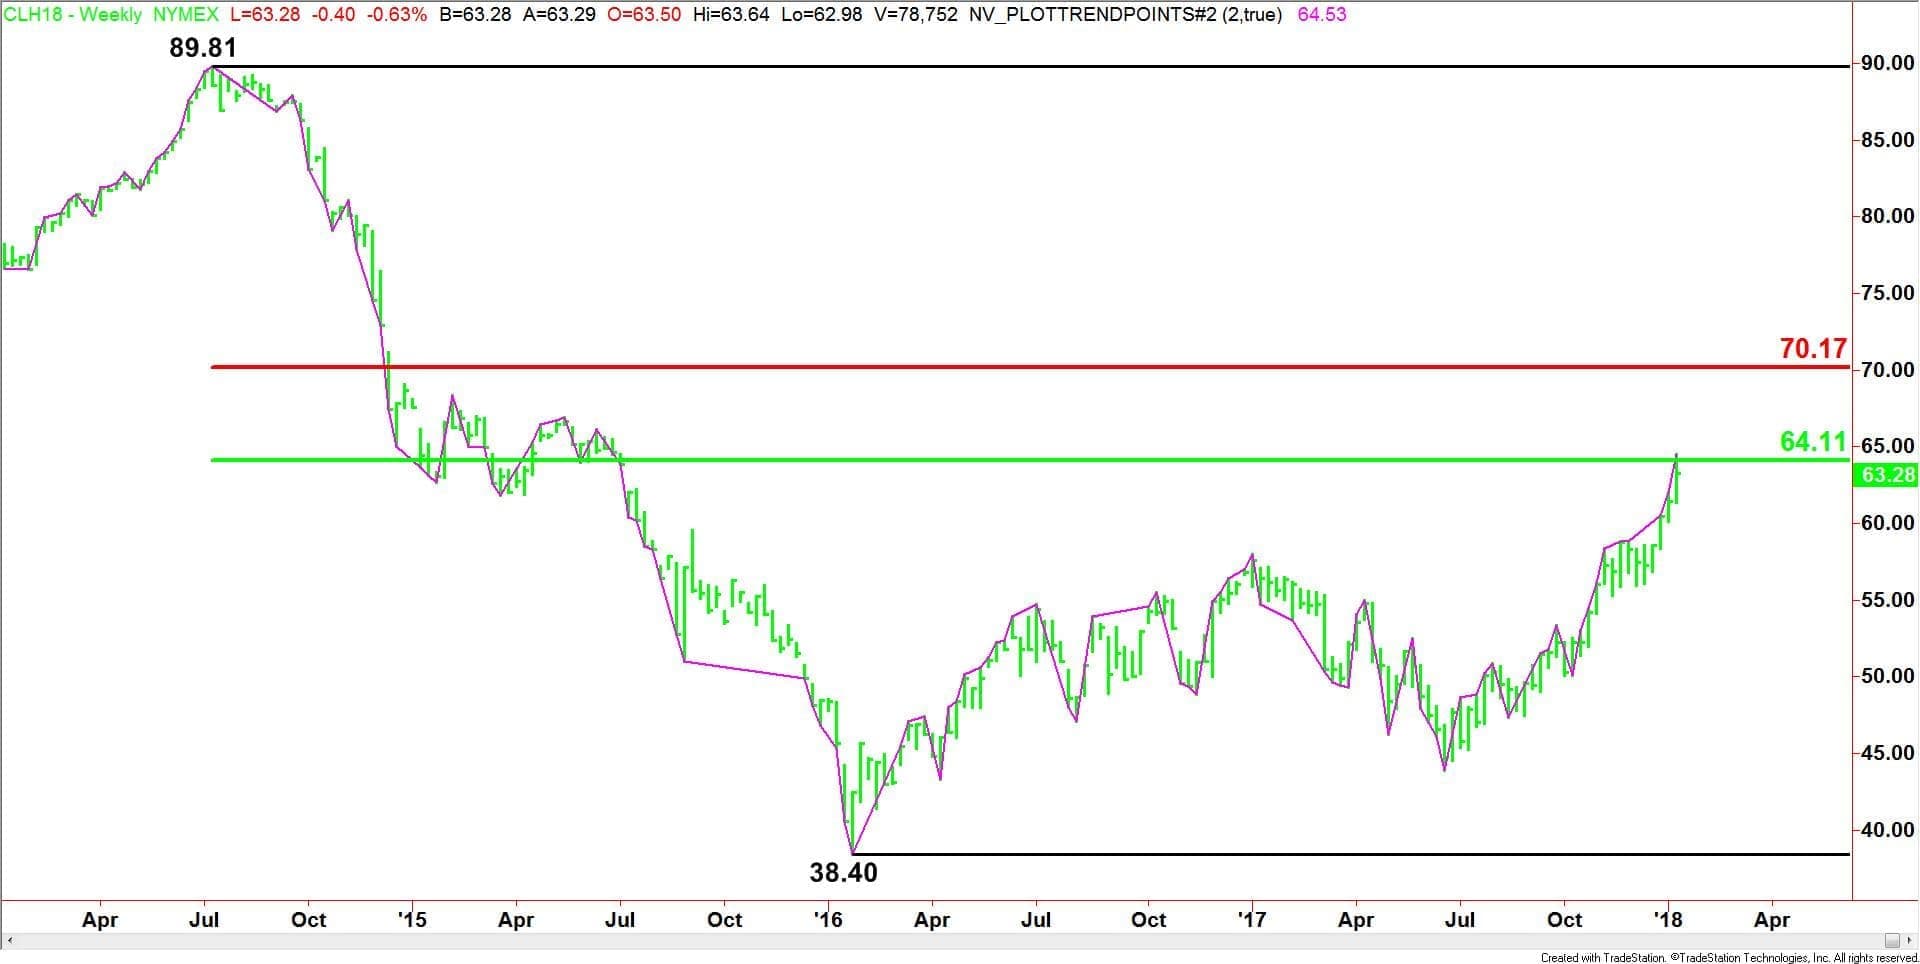
Weekly March West Texas Intermediate Crude Oil
(Click to enlarge)
The main trend is up according to the weekly chart. The higher-top, higher-bottom chart pattern confirms the uptrend.
The longer-term weekly chart shows the top of the weekly chart at $89.81 and the bottom at $38.40. Its 50% to 61.8% retracement zone is $64.11 to $70.17.
Trader reaction to the retracement zone will determine the longer-term trend on the weekly chart.
A sustained move under the $64.11 level will indicate the market is running into resistance. Trading between $64.11 and $70.17 will indicate a balance market. Overtaking and sustaining a move over $70.17 will put the market in an extremely bullish position.
(Click to enlarge)
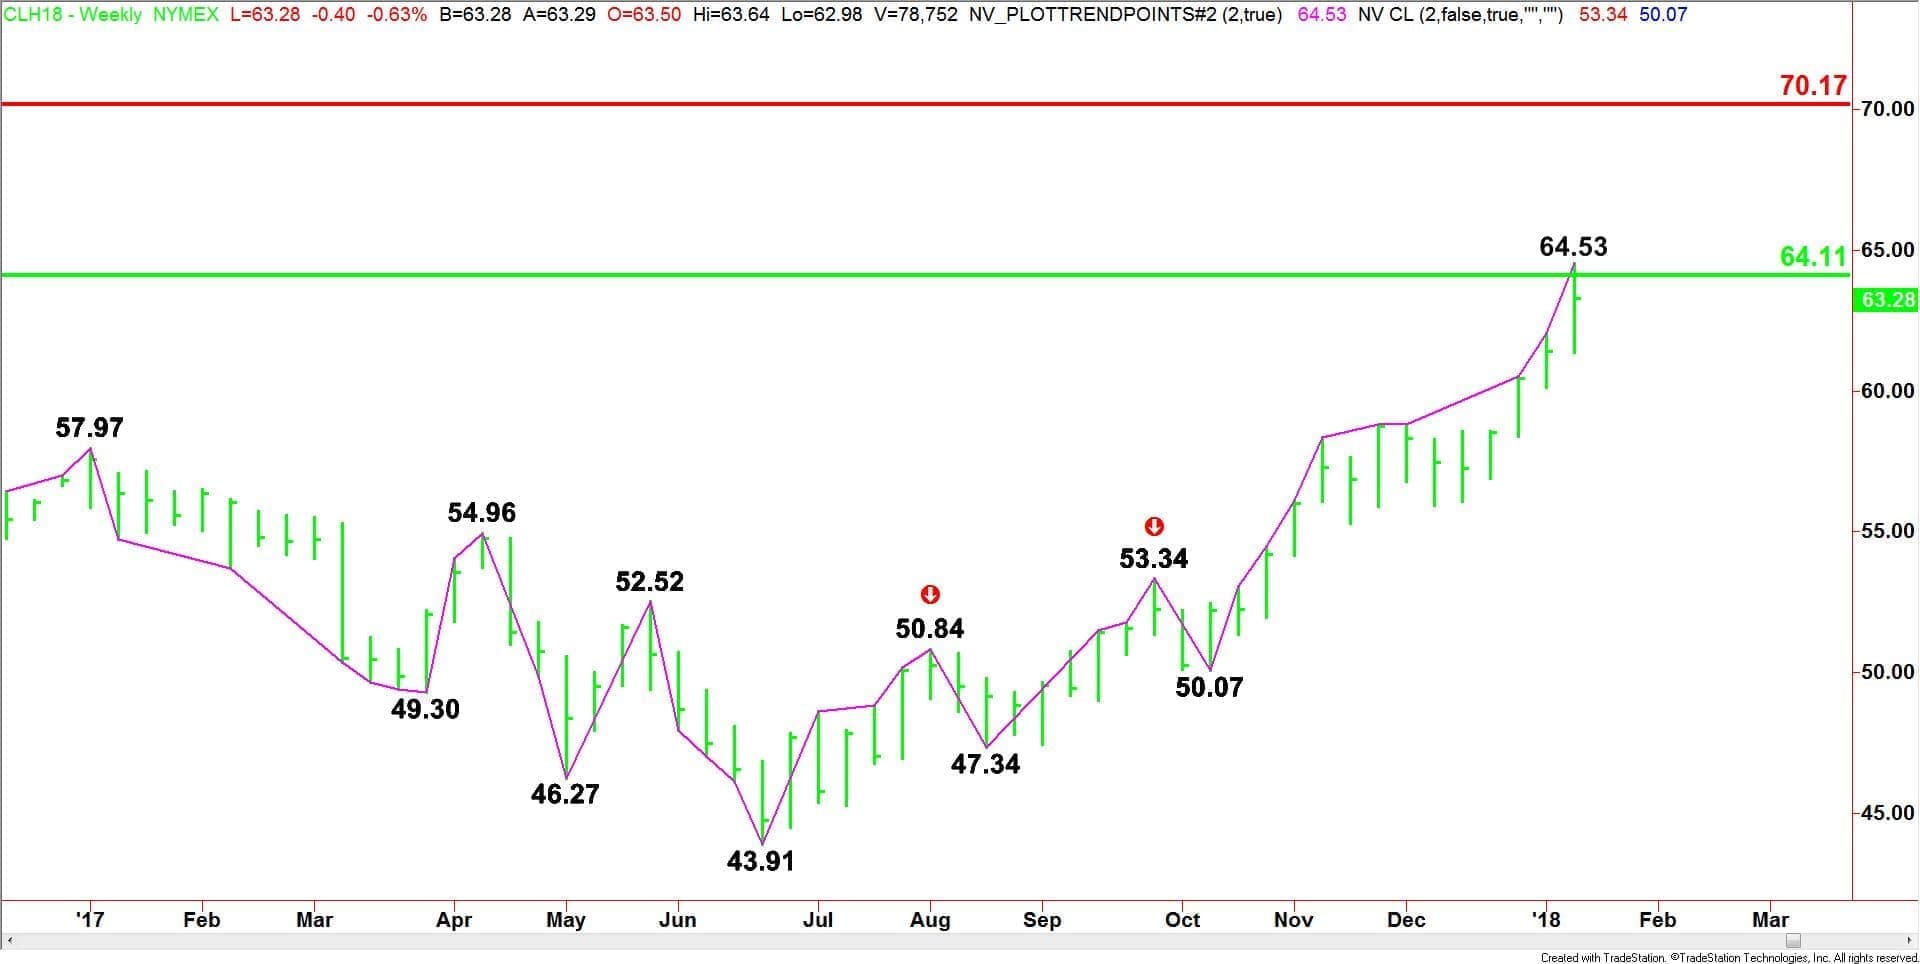
A short-term look at the market shows that since the $43.91 bottom, the market has had a pair of two-week corrections. The first correction was $50.84 to $47.34, the second $53.34 to $50.07. This is a sign of strong buying. If we do get a correction from the $64.53 high then we should expect a normal two-week break. If the break exceeds two weeks then this will be the first sign of increasing selling pressure.
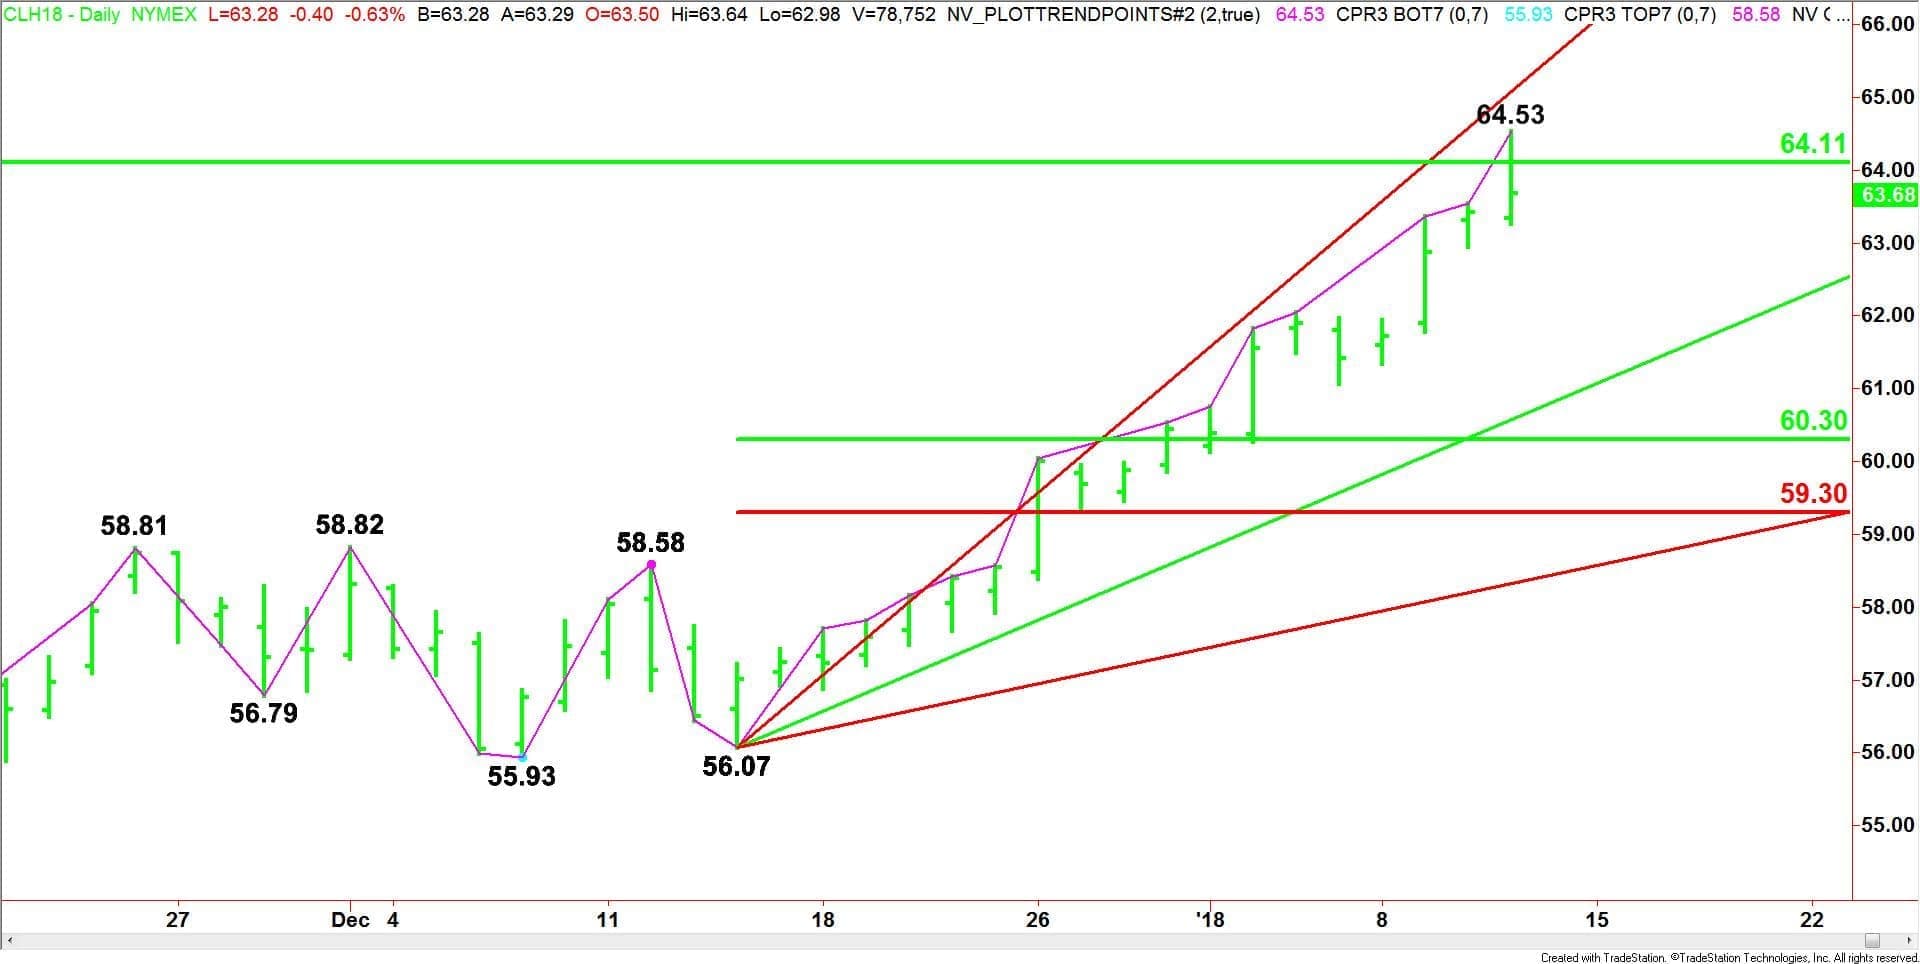
Daily March West Texas Intermediate Crude Oil
(Click to enlarge)
The main trend is up according to the daily swing chart. The trend turned up on December 26 when the market crossed a series of former tops at $58.58, $58.81 and $58.82. This area is major support.
The contract range is $89.81 to $39.40. Its 50% level is $64.11. This level was reached and exceeded on January 11. This level is very important to the longer-term structure of the market because it represents the mid-point of the futures contract. It is often used to gauge the strength of the market. Although the market exceeded this level on Thursday, the market closed below. This indicates selling pressure.
The main range is $56.07 to $64.53. Its 50% to 61.8% retracement zone is $60.30 to $59.30. If there is a correction then this zone will become the primary downside target.
Since the rally began on December 14, we have not seen two days of consecutive lower-lows. This indicates strong buying during the move. If we do see two days of lower-lows then this will indicate the presence of sellers or that the buying is slowing. This will be the first sign of a short-term top.
The formation of a short-term top will not mean the trend is changing to down, but it could lead to an eventual test of the retracement zone.
The price action this week suggests investors are showing respect for the major 50% level at $64.11. Trader reaction to this zone will likely determine the near-term direction of the market.