U.S. West Texas Intermediate crude oil finished 2017 higher in what can best be described as a volatile two-sided trade. After trending lower from January to June, the market stabilized enough to fuel an even stronger rally during the latter half of the year, ending on a high note after reaching its highest level since July 2015.
WTI crude oil is in a position to pick up where it left off in 2017 by finishing higher the first week of the new year higher on concerns that the escalation of unrest in Iran will eventually have an effect on supply and another decline in U.S. inventories as refining activity hit a 12-year high.
According to weekly government statistics, U.S. stocks fell more than expected, continuing a steady drawdown of supplies in the world’s largest oil consumer, though stocks of distillates and gasoline rose on heavy refining activity driven in part by year-end adjustments.
The U.S. Energy Information Administration reported that U.S. crude stocks fell by 7.4 million barrels in the last week of 2017, exceeding expectations, as refiners boosted activity to their highest rate since 2005.
Some traders are starting to question the validity of the rally since the unrest in Iran is expected to have no impact on the OPEC member’s ability to produce oil. Furthermore, the North Sea Forties and the Libyan pipelines are back to carrying oil. Additionally, U.S. production will likely break though 10 million barrels per day.
Ignoring the potentially…
U.S. West Texas Intermediate crude oil finished 2017 higher in what can best be described as a volatile two-sided trade. After trending lower from January to June, the market stabilized enough to fuel an even stronger rally during the latter half of the year, ending on a high note after reaching its highest level since July 2015.
WTI crude oil is in a position to pick up where it left off in 2017 by finishing higher the first week of the new year higher on concerns that the escalation of unrest in Iran will eventually have an effect on supply and another decline in U.S. inventories as refining activity hit a 12-year high.
According to weekly government statistics, U.S. stocks fell more than expected, continuing a steady drawdown of supplies in the world’s largest oil consumer, though stocks of distillates and gasoline rose on heavy refining activity driven in part by year-end adjustments.
The U.S. Energy Information Administration reported that U.S. crude stocks fell by 7.4 million barrels in the last week of 2017, exceeding expectations, as refiners boosted activity to their highest rate since 2005.
Some traders are starting to question the validity of the rally since the unrest in Iran is expected to have no impact on the OPEC member’s ability to produce oil. Furthermore, the North Sea Forties and the Libyan pipelines are back to carrying oil. Additionally, U.S. production will likely break though 10 million barrels per day.
Ignoring the potentially bearish fundamentals puts some speculative buyers in danger of getting caught in a bull trap when the market does turn down. Currently, it is being driven by aggressive hedge and commodity fund buying, however, they could dry up quickly and investors could start booking profits in an effort to drive the markets back to more justifiable price levels.
Technical Analysis
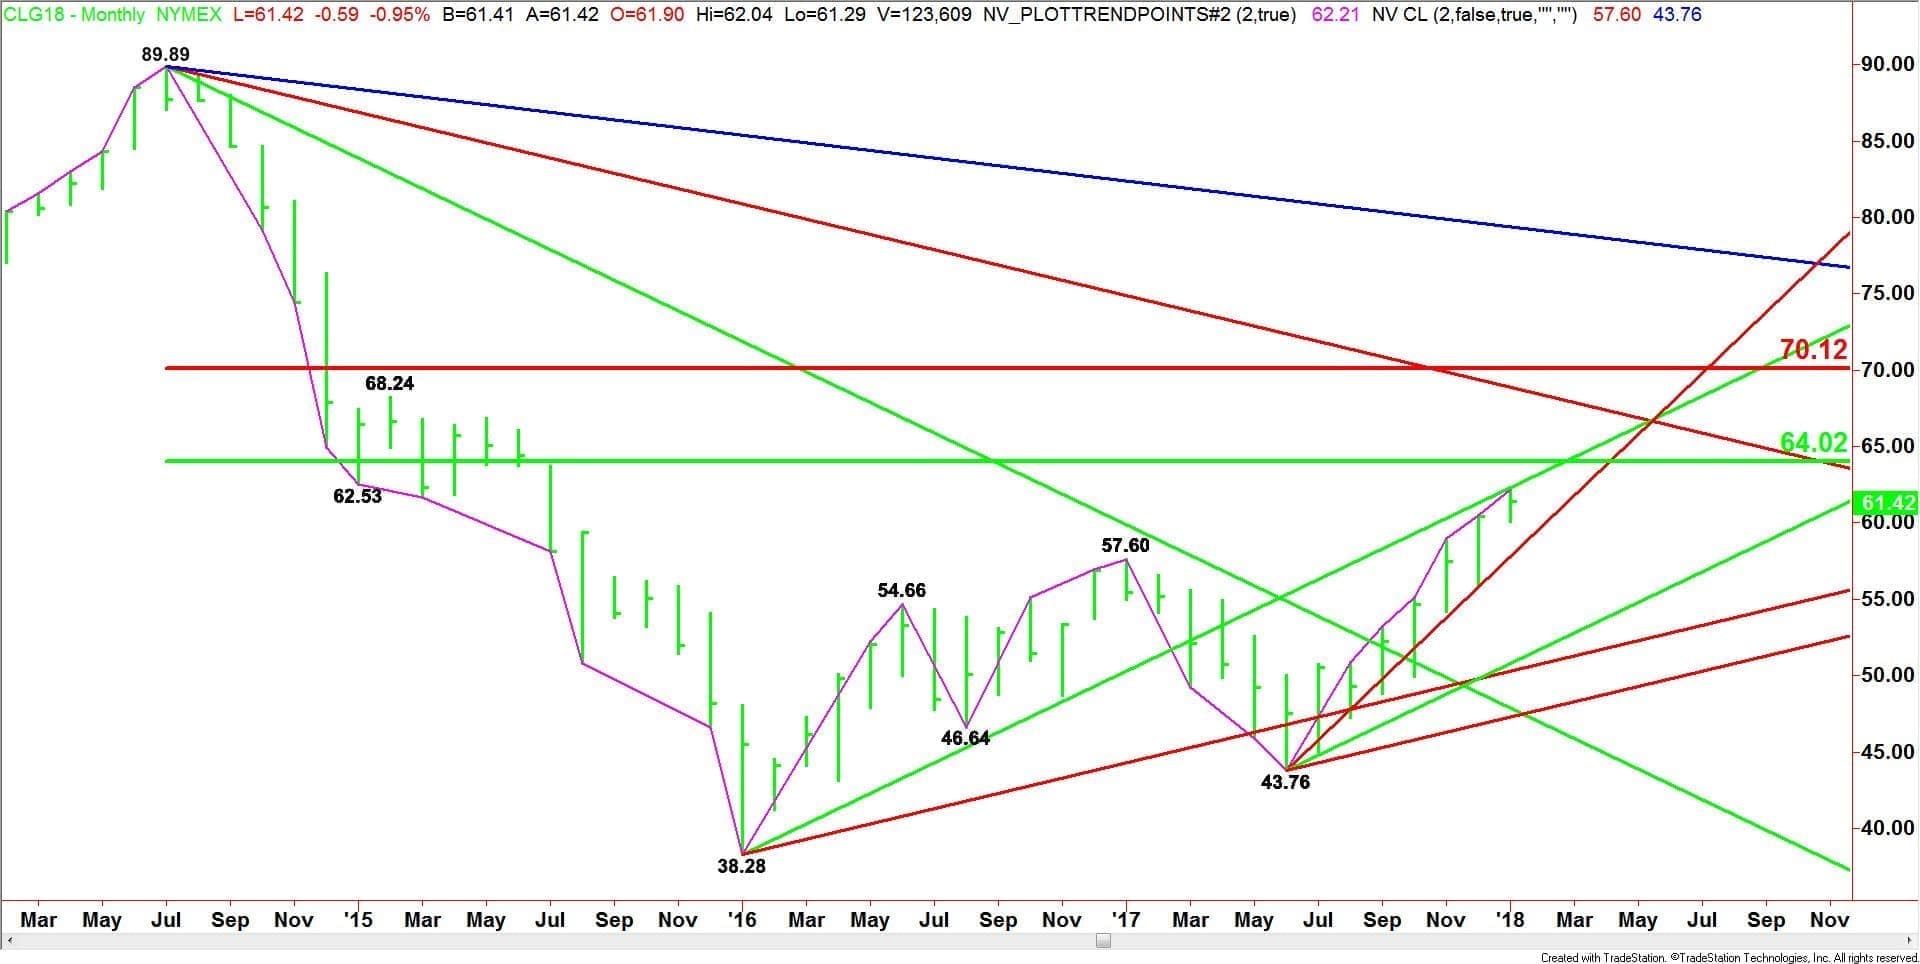
Monthly February West Texas Intermediate Crude Oil

(Click to enlarge)
The main trend is up according to the monthly swing chart. It turned up in November when the market crossed the last swing top at $57.60. This price is now minor support.
Although the trend is up, the rally is seven months old which puts it in the window of time for a potentially bearish closing price reversal top. It’s still early in the month, but a move back under $60.42 will be the first sign of a short-term top.
The main range is $89.89 to $32.28. Its retracement zone at $64.02 to $70.12 is the primary upside target. A downtrending Gann angle also passes through this zone at $68.89, making it a valid target also. This area should provide some resistance which could actually lead to the formation of a closing price reversal top on the monthly chart.
Monthly Technical Forecast
Based on the current price at $61.42 and the price action earlier this month, it looks as if the direction of the market the rest of the month is going to be determined by trader reaction to the uptrending Gann angle at $62.28.
A sustained move over $62.28 will indicate the presence of buyers. This could generate the momentum needed to challenge the major 50 percent level at $64.02. We could see some counter-trend selling on the first test of this level. However, it is also the trigger point for an acceleration to the upside with potential targets at $68.89 and $70.12.
The inability to overcome and sustain a rally over $62.28 will signal the presence of sellers. This could trigger a pullback into a steep uptrending Gann angle at $57.76.
This angle, moving up at a rate of $2.00 per month, is important because it has been providing support and guidance for crude oil since the $43.76 main bottom in June 2017.
We expect to see buyers come in on a test of this angle, however, it is the trigger point for a possible acceleration to the downside. The daily chart indicates that if $57.76 fails, prices could collapse to at least $54.50.
Basically, look for the upside bias to continue on a sustained move over $62.28 with the next major target $64.02. Watch for a downside bias to develop under $62.28 with the key target angle coming in at $57.76.