Breaking News:

Oil Moves Higher on Crude, Fuel Inventory Draw
Crude oil prices ticked higher…

Oil Rig Count Jumps as Drilling Activity Picks Up
The total number of active…
Could Gold Be Gearing Up For A Major Rally?
RESEARCH HIGHLIGHTS:
- Gold rebounded quickly and broke to higher prices after the COVID deep selling.
- Our Fibonacci support levels for Gold are resting near $1,885, $1,815 & $1,790.
- More downside pressure on price is possible, but if support is maintained at $1,885 then we could see a big upside recovery trend take Gold to $2,250.
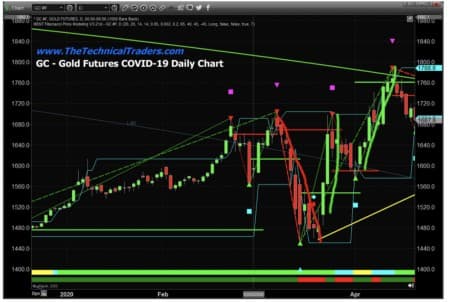
Just before the COVID-19 collapse in the markets hit near February 25, 2020, Gold started a double-dip move after reaching $1,692 on February 24. First, Gold dipped from $1,692 to $1,564, then recovered to new highs ($1,704.50) on March 10, 2020. Then, as the deeper COVID-19 selling continued, Gold prices dipped again – this time targeting a low level of $1,450.90.
What we found interesting is how quickly Gold prices recovered and broke to even higher price levels after this deep selling. Our belief is that when a crisis event first hits, which we sometimes call the “shock-wave”, all assets take a beating – including Gold and Silver. This is the event where traders and investors pull everything to CASH (closing positions). Then, as the shock-wave ends, traders re-evaluate the price levels of assets to determine how they want to deploy their capital.
Gold Basing Near $1885 For A Big Rally?
Our belief that this DIP or double-dip pattern in Gold because of crisis events presents a very solid opportunity for skilled traders to add-to existing positions or strategically target shorter-term upside price swings in precious metals.
This Daily Gold chart below highlights the first dip and the second dip in Gold prices as the COVID-19 price collapse took place. Notice how Gold rotated lower, then recovered to new highs, then dipped even lower in early March 2020. This last dip in price levels was the very deep selling before the March 21 bottom setup (US Fed induced).

Now, take a look at the current Gold Futures Daily chart. Notice the big price correction that started on August 7, 2020 – setting up the FLAG/Pennant formation in Gold. Interestingly enough, this top in Gold also aligns with a moderately deep price correction in the NASDAQ – before continuing to rally even higher. Silver also setup a price peak on August 7, 2020. Now, as the Banking illegalities report has been released, the markets again fell into a shock-wave of selling on Monday, August 21. This time Gold fell just over 3% throughout the day before starting to recover near the end of the day.
Related: Natural Gas Prices Jump Again On Smaller-Than-Forecast Stock Build
Currently, our Fibonacci support levels are resting near $1,885, $1,815 & $1,790 as you can see from the Gold Daily chart below. We believe more downside price pressure may continue in Gold and Silver over the next few days before a strong upside price move begins to take place. The recent low price level in Gold, near $1,885, aligns perfectly with our Fibonacci projected price target (Support) level. If Gold has already found support near this price level, then we may already be hammering out a bottom in Gold setting up a big upside recovery trend.

The question for gold traders right now is “does the $1,885 level hold as support or will gold break lower trying to fund support?”. My researchers and I believe the current bottom in Gold is set up and the $1,885 price will hold as support. We also believe the next move higher will prompt a rally targeting levels near $2,250.
Watch for the momentum base to continue to form near $1,885 before the breakout rally trend in Gold starts. Once it breaks the $2,035 level, it should start to rally upward very quickly. If the price of Gold breaks down below $1,885 then we may experience a continuing bottom to the next support level of $1,815.
As a technical analyst and trader since 1997, I have been through a few bull/bear market cycles in stocks and commodities. I believe I have a good pulse on the market and timing key turning points for investing and short-term swing traders.
By Chris Vermeulen
More Top Reads From Oilprice.com:
- Egypt Boasts Record Crude Oil Production
- How Saudi Arabia Put OPEC's Future At Stake
- Colombia’s Security Crisis Deals Another Blow To Its Oil Industry
Chris Vermeulen
Chris Vermeulen has been involved in the markets since 1997 and is the founder of Technical Traders Ltd. He is an internationally recognized technical analyst,…
Open57.81
Trading Vol.6.96M
Previous Vol.241.7B


