


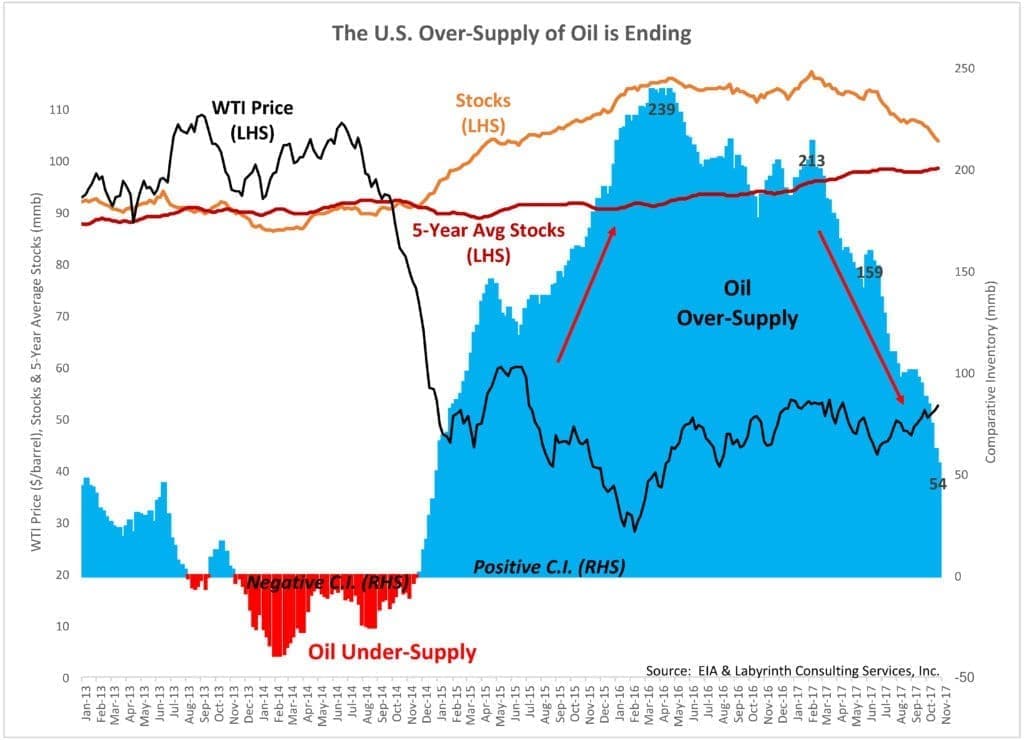
Comparative inventory (C.I.) has been dramatically reduced in 2017. Levels have fallen 159 mmb since February and are now approaching the 5-year average for the first time in nearly 3 years (Figure 1).
(Click to enlarge)
Figure 1. The U.S. Over-Supply of Oil is Ending. Source: EIA and Labyrinth Consulting Services, Inc.
An interpreted yield curve that correlates C.I. and WTI price is developed by cross plotting the same data without the time dimension (Figure 2). The yield curve may provide price solutions to inventory reduction assumptions in the near term.

(Click to enlarge)
Figure 2. Crude + Product Comparative Inventory Have Fallen 159 mmb in 2017. C.I. Could Reach the 5-Yr Avg By & $70 WTI Prices by Early 2018. Source: EIA and Labyrinth Consulting Services, Inc.
Accordingly, if C.I. continues to fall at the 9-month average of 4 mmb/week, oil prices may be approximately $67 per barrel by the end of December. If C.I. falls at the 8 mmb/week average since late September, WTI could approach levels not seen since before the price collapse in late 2014.
Exports and The Brent-WTI Spread
The causes of the U.S. inventory drawdown are clear: increased exports of crude oil and greater domestic consumption.
Crude oil exports for the first half of 2017 averaged 766 mmb/d but rose to 1.8 mmb/d in September and October. Increased exports now average more than 12 mmb/week and contribute substantially to reduced inventory levels.
Higher export levels correlate with the increased spread between Brent and WTI prices that began in late July (Figure 3). Traders can sell U.S. crude oil overseas at less than international prices but at levels higher than domestic pricing allows. Record exports of 2.13 mmb/d occurred during the week ending October 27.

(Click to enlarge)
Figure 3. U.S. Crude Oil Exports Reached Record 2.13 mmb/d Week Ending Oct. 27. Higher Export Volumes Correlate With Increased Brent-WTI Price Spread. Source: EIA and Labyrinth Consulting Services, Inc.
Tight oil production levels, crude oil quality and U.S. refinery blending needs are behind the WTI discount to Brent price. Most U.S. refineries are designed for international grades of oil like Brent which is heavier and contains more sulfur than WTI.
The U.S. has had a surplus of light sweet oil since the tight oil boom began, and the Brent-WTI spread reached almost $30/barrel in September 2011 as a result (Figure 4).

(Click to enlarge)
Figure 4. Brent-WTI Price Spread Related to Surplus Tight Oil Production. Source: EIA and Labyrinth Consulting Services, Inc.
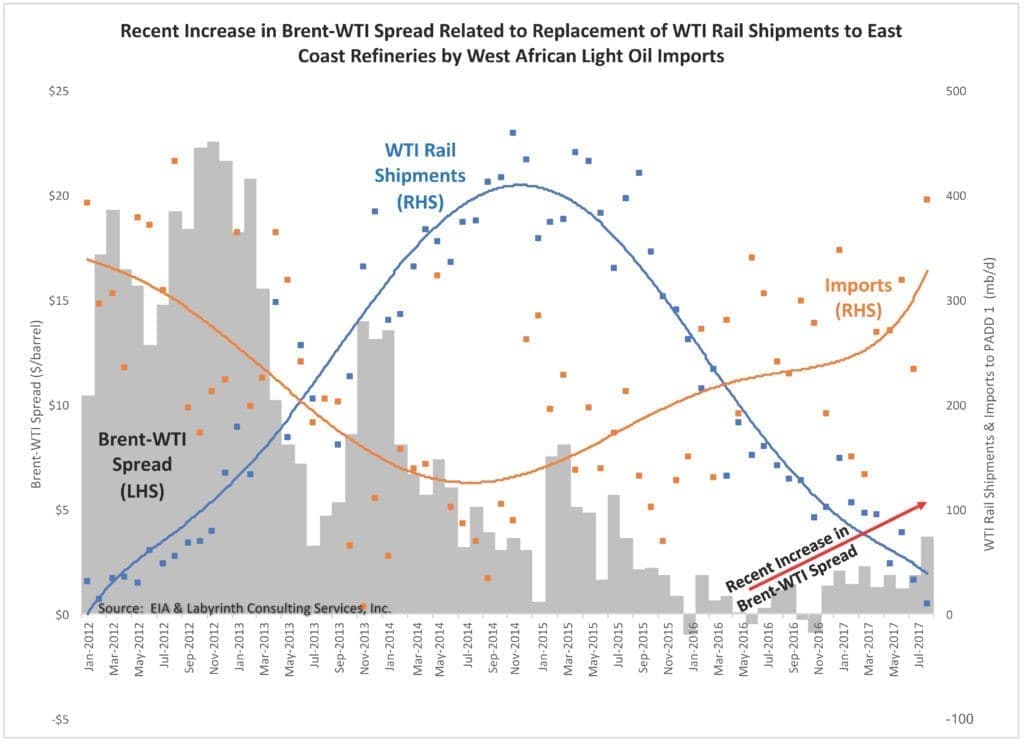
The spread decreased to about $2.25 with the advent of rail shipments of WTI to East Coast refineries, and associated reduced light oil imports. The transport cost was reasonable when oil prices were $100 per barrel but lower oil prices after 2014 resulted in a progressive decline in rail shipments (Figure 5). East Coast refiners increasingly relied again on imported light oil mostly from West Africa to blend with heavier grades of oil.
(Click to enlarge)
Figure 5. Recent Increase in Brent-WTI Spread Related to Replacement of WTI Rail Shipments to East Coast Refineries by West African Light Oil Imports. Source: EIA and Labyrinth Consulting Services, Inc. Related: Big Oil Plans Blockchain-Based Trading Platform
A surplus of tight oil returned as production recovered as a result higher oil prices in 2016 and 2017. Surplus supply caused discounted WTI prices, and the recent increase in the Brent-WTI spread. Some of the excess oil has been exported in recent weeks but the price spread persists because import levels are so far unaffected.
Consumption
The second major cause of the U.S. inventory drawdown is increased domestic consumption of refined products.
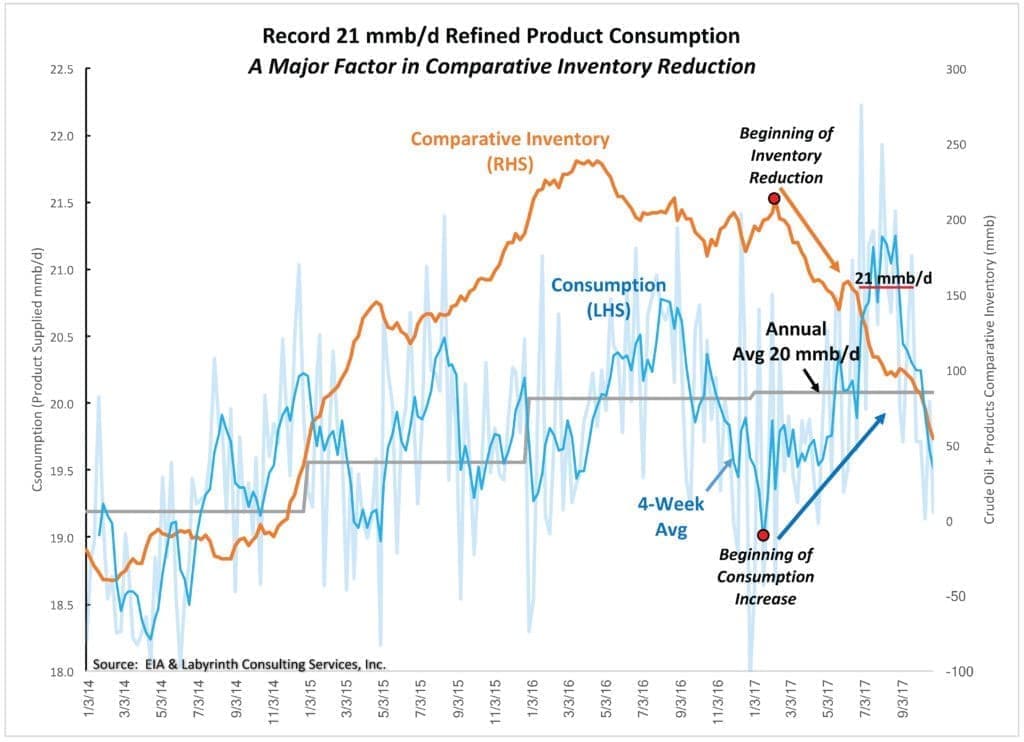
Consumption reached a 10-year record of 21 mmb/d during the summer of 2017 (Figure 6). August 2017 consumption was 300 kb/d more than in August 2016 and that difference accounts for more than 2 mmb/week of incremental inventory reduction. In fact, the increase in consumption that began in January coincided with the beginning of comparative inventory reduction in February (red dots in Figure 6).
(Click to enlarge)
Figure 6. Record 21 mmb/d Refined Product Consumption in Summer 2017 A Major Factor in Comparative Inventory Reduction. Source: EIA and Labyrinth Consulting Services, Inc.
The greatest portion of consumption is from transportation. The declining growth rate of vehicle miles traveled (VMT) that began in early 2016 reversed in the second quarter of 2017 despite somewhat higher gasoline prices (Figure 7).

(Click to enlarge)
Figure 7. Declining Growth Rate of Vehicle Miles Traveled Reversed in Q2 2017 Despite Higher Gasoline Price. Source: U.S. Federal Reserve Bank, EIA and Labyrinth Consulting Services, Inc.
VMT data is only available through July but it is likely that growth continued at least through August based on consumption data that is more current.
The Possible Downside of Consumption
It is reasonable to question the capacity of the rest of the world to continue to absorb U.S. exports. Exports have increased in each of the last 6 weeks except the week ending October 6, and exports that week were still a robust 1.3 mmb/d. It is impossible to get reliable inventory data for most of the rest of the world but OECD data suggests inventory reductions similar to those described in the U.S.
Continued high U.S. consumption is the only area of concern for sustained higher oil prices. September and October consumption were considerably lower than in August. It is normal for consumption to decline after the summer driving season but the magnitude of the decline is disturbing.
October consumption was 1.2 mmb/d (38 mmb/month) less than in August (Figure 8). That is almost as much as the total August-to-January seasonal decline during the previous year (1.4 mmb/d, 42 mmb/month).

(Click to enlarge)
Figure 8. October U.S. Consumption Was 1.2 mmb/d (-38 mmb) Less Than Than In August, Almost As Much As Total August-January Seasonal Fall in 2016. Source: EIA and Labyrinth Consulting Services, Inc.
The data may be biased by the effects of hurricanes Harvey and Irma, and two months do not define a trend. It is, nevertheless, a troubling observation despite the fact that it will probably not affect inventory levels or oil prices in the rest of 2017.
Consumption becomes a greater concern if oil prices increase as much as I expect because gasoline prices will increase accordingly–consumption and gasoline price are negatively related (Figure 9). Higher oil price means higher gasoline price and lower consumption.

(Click to enlarge)
Figure 9. U.S. Consumption is Inversely Related to Gasoline Price. Higher Oil Price Means Higher Gasoline Price & Lower Consumption. Source: U.S. Federal Reserve Bank, EIA & Labyrinth Consulting Services, Inc.
$70 WTI will result in almost a $1/gallon price increase above the current average retail price of $2.53 and that may depress consumption.
The U.S. Over-Supply of Oil Is Ending
Increased exports of crude oil have reduced U.S. inventories more quickly than I expected a month ago when I wrote Higher Oil Prices Likely in Early 2018. Higher consumption levels were well established at that time but evidence for a trend of elevated export levels consisted of two anomalous data points.
Because of the way that trades are arranged, if the Brent-WTI spread closed tomorrow, continued high export levels are almost inevitable through the end of the year. That means that oil prices will increase at least for the near term.
Comparative inventory is not a predictive methodology. It is, however, a powerful tool because it identifies trends that correlate inventory change and oil price. As such, it can provide price solutions to inventory reduction scenarios. Those scenarios suggest that WTI prices in the $60 to $70 range are almost certain in early 2018, and that prices higher than $70 are also possible.
The U.S. over-supply of oil is ending. It is likely that comparative inventory will be near or even below the 5-year average by the end of 2017 or early in 2018. Higher oil prices may be good for oil companies but bad for consumers.
For the first time since the 2008 financial crisis, the U.S. and global economy appear to have some reasonable potential for growth. Economists are generally too preoccupied with monetary policy, interest rates and abstract mathematical models to see the obvious connection between the price of oil, our master resource, and economic growth.
Related: Russia Aims To Dominate Middle East Energy
Will higher oil prices smother the weak flicker of economic growth that now seems possible?
Higher prices will unquestionably provoke a new flood of capital to E&P companies. Although demand is important, producer behavior and the impulse for over-production have been the defining aspects of the last decade in the oil industry. Under-investment and limited availability of frack crews have modulated supply since early 2015. That will change probably later in 2018.
The path to price recovery will not be straight. The elegant interplay between higher oil prices, credit and the impending threats of over-supply and under-supply will continue. In the medium term, we will learn whether tight oil plays in fact have sufficient reserve potential to meet global supply needs. My guess is that they do not.
That means reliance on more costly deep-water projects that have much longer development time lines. Associated reserves are largely known and, while considerable, are insufficient for more than about a decade of demand.
Supply and its alter-ego credit are central to mapping the implications of the topics I have discussed here. Most investors and analysts assume---perhaps unconsciously---that future supply will be more abundant than present supply. What if they are wrong?
* Help from J.M Bodell and Matt Smith are gratefully acknowledged.
By Art Berman
More Top Reads From Oilprice.com:
- Putin’s Masterstroke Of Energy Diplomacy
- Ignore The Hype: Oil Is Still In A Bear Market
- Is A Venezuelan Default Inevitable?


I will say, you outline the struggle between supply and demand very well...and caution about the possibility of decreased US demand but not a word about possible geopolitical supply disruptions??
Nigeria, Libya and Venezuela all have major issues - not to mention what a war in the Middle East would do.
Maybe US demand worries = Geopolitical supply worries...I wish there was a graph we could use to analyze that equation!
Shark
I don't see how. Even at $80, by my calculations about $3 is the max US avg retail price.
Weird custom. I don't get it. Always have to pause to try to understand what's really meant.