With the cold weather season rapidly approaching in the United States, I thought I’d take a look at the natural gas market this week. Currently, the market is going through the time period which would normally lead to a sideways to lower chart pattern. However, this year, the natural gas market has taken on more volatility than expected.
The price action the past seven session has been particularly interesting, but in hindsight, we have to conclude that the volatility has been all about thin trading conditions and rapid shifts in the weather patterns.
On October 19, for instance, sellers took control, driving the December futures contract through a recent bottom at $3.013. It wasn’t much of a break down, however, with the market stopping at $3.012 before rebounding to close higher on the daily chart.
(Click to enlarge)
The price action indicated two things: buyers were coming in to support the market or bearish traders were reluctant to sell weakness.
After hitting the new low for the month at $3.012, the subsequent reversal bottom trigger a gap higher opening on October 23. This move was strong enough to take out a previous top at $3.185, changing the trend to up.
So what we had was a change in trend to down then a change in trend to up within a two-day period. Talk about trader indecision.
One can’t blame the buyers, however, because the weather bureaus put cold into the forecast for the Midwest and East Coast, two highly…
With the cold weather season rapidly approaching in the United States, I thought I’d take a look at the natural gas market this week. Currently, the market is going through the time period which would normally lead to a sideways to lower chart pattern. However, this year, the natural gas market has taken on more volatility than expected.
The price action the past seven session has been particularly interesting, but in hindsight, we have to conclude that the volatility has been all about thin trading conditions and rapid shifts in the weather patterns.
On October 19, for instance, sellers took control, driving the December futures contract through a recent bottom at $3.013. It wasn’t much of a break down, however, with the market stopping at $3.012 before rebounding to close higher on the daily chart.

(Click to enlarge)
The price action indicated two things: buyers were coming in to support the market or bearish traders were reluctant to sell weakness.
After hitting the new low for the month at $3.012, the subsequent reversal bottom trigger a gap higher opening on October 23. This move was strong enough to take out a previous top at $3.185, changing the trend to up.
So what we had was a change in trend to down then a change in trend to up within a two-day period. Talk about trader indecision.
One can’t blame the buyers, however, because the weather bureaus put cold into the forecast for the Midwest and East Coast, two highly populated demand areas. Not only did they call for cold weather, but they also inserted the word “lingering” which tends to spark a wave of speculative buying.
The rally died at $3.198, a victim of a change in the weather forecast and a major technical retracement zone at $3.183 to $3.223. The inability to continue the rally and a shift in the short-term fundamentals drew the attention of short-sellers who forced the speculative longs out of the market.
As we write, the December natural gas futures market is in a freefall with no support in sight following a break through the recent bottom at $3.012.
The price action the past two weeks represents a microcosm of the price action we’ve seen all year. It shows that speculative buyers have been willing to support the market on the first sign of bullish weather, but the major players have been unwilling to let up on the short side. They treated almost every rally this year as a new shorting opportunity. Their focus remained on the primary theme of the year, overproduction.
Weekly December Natural Gas Technical Analysis
(Click to enlarge)
The weekly chart clearly shows the market is in a down trend. Throughout the year, the market was held up by a major retracement zone. This price action represented investor indecision. Bearish traders didn’t want to sell weakness through the zone because it was too early in the season to short aggressively. Bullish traders treated the zone as support and buyers defended the zone because there was still the possibility of a weather-related rally.
The main range is $2.640 to $3.747. Its retracement zone is $3.194 to $3.063. You can see from the chart that investors treated this zone like support throughout the summer.
This week, it looks as if buyers have finally thrown in the towel since the market is breaking decisively lower through this zone. With the market now on the weak side of the retracement zone, traders should treat it like resistance.
The weekly chart also indicates there is plenty of room to the downside, so the selling pressure could accelerate over the near-term.
Longer-Term Outlook
At this time, traders are saying that producers will have added just 1.7 trillion cubic feet of gas into storage when the injection season ends on October 31. This is mainly due in part to low output earlier in the year and rising sales abroad.
Although this number looks potentially bullish on paper, the price action is saying something else.
The 1.7 tcf figure is much less than the 2.1 tcf seen on average over the past five years. If correct, that would leave stockpiles at the end of October at about 3.8 tcf compared to a record high of 4.0 tcf on October 31 last year and a five-year average (2012-2016) of 3.9 tcf.
For the week-ending October 20, the U.S. Energy Information Administration said the amount of fuel in stock was about 1 percent below the five-year average for this time of year at around 3.7 trillion cubic feet.
Well, why isn’t natural gas rallying? Probably because utilities are likely to continue to add gas into storage through the middle of November this year, boosting total stocks to about 3.9 tcf, which is near the five-year average for the annual peak.
This number is bearish because traders believe it should be more than enough to meet demand this winter if the latest forecasts for another warm winter are correct.
(Click to enlarge)
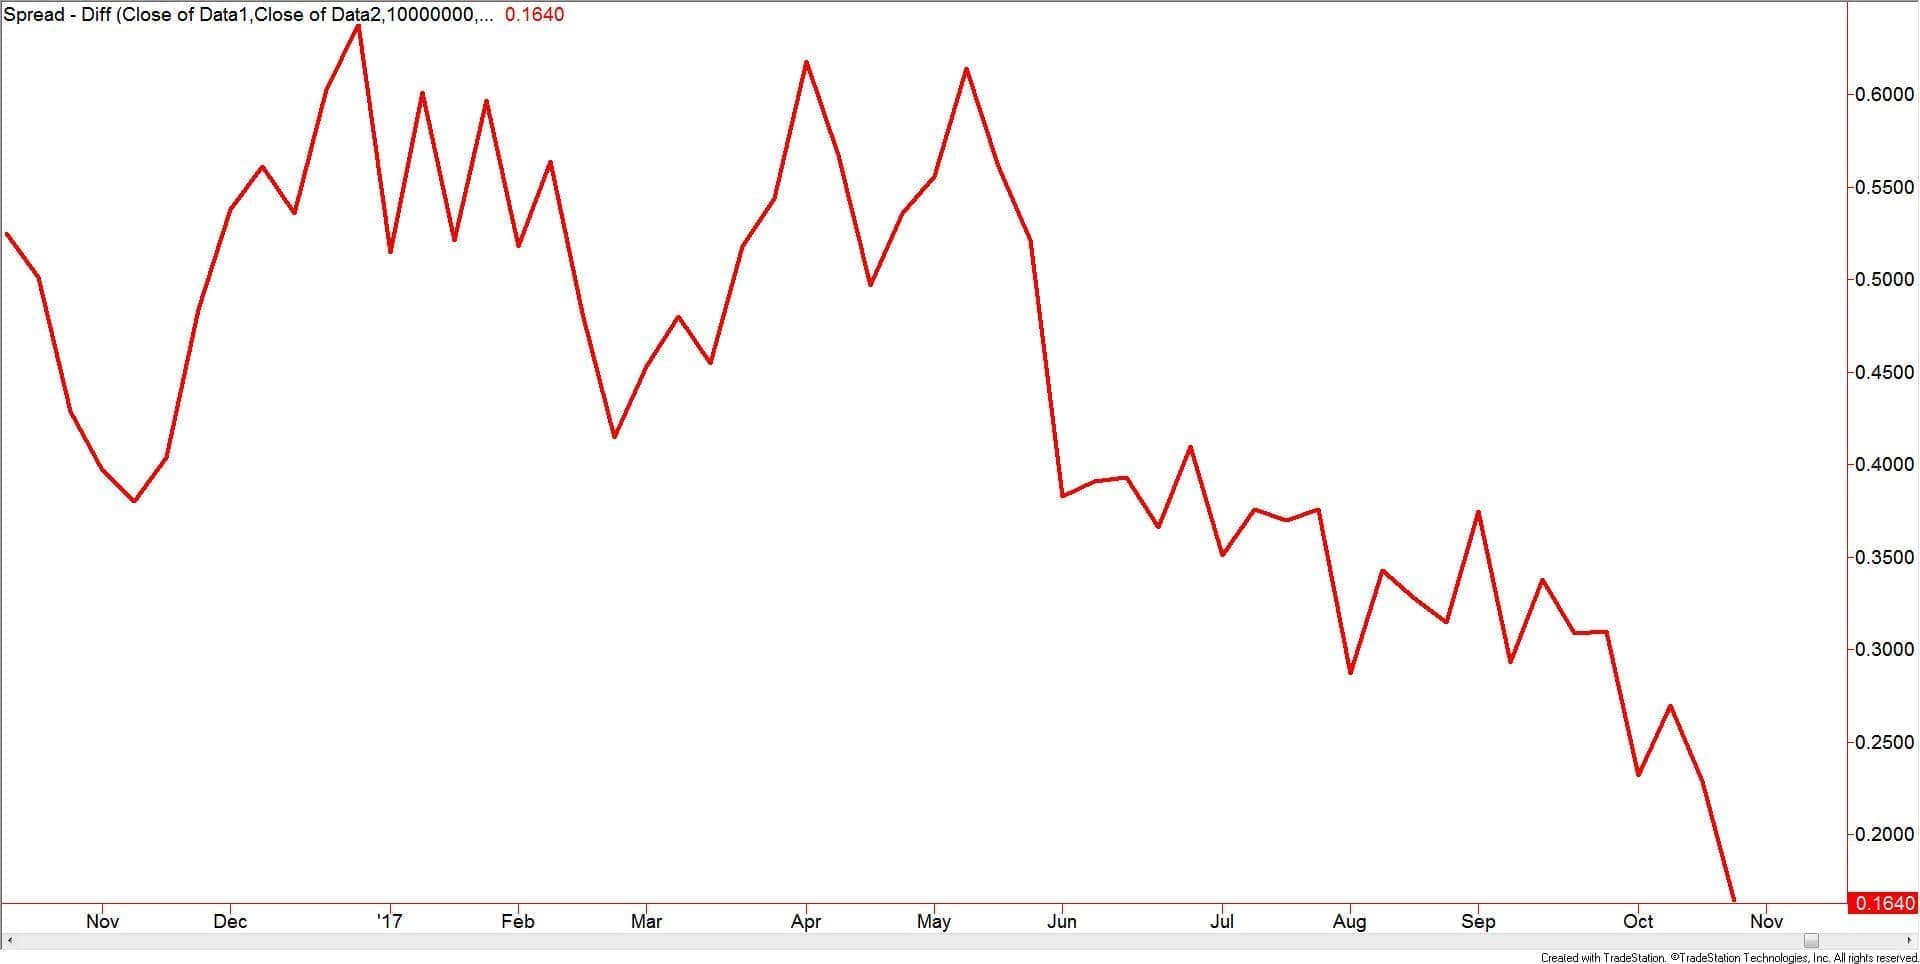
According to the U.S. National Weather Service, temperatures in December, January and February are expected to be warmer than normal across much of the country again this year. Because of this, the premium of March 2018 futures over April 2018, a spread traders use to bet on winter weather, has fallen to its lowest level in more than five years.
This spread is expected to continue to widen as long as the forecast remains intact. Traders should use this spread to predict any meaningful shifts in the temperature forecast.