


When it comes to the story we're being told about America's rosy oil prospects, we're being swindled.
At its core, the swindle is this: The shale industry's oil production forecasts are vastly overstated.
Swindle: Noun - A fraudulent scheme or action.
And the swindle is not just affecting the U.S. It's badly distorted everything from current geopolitics to future oil forecasts.
The false conclusions the world is drawing as a result of the self-deception and outright lies we're being told is putting our future prosperity in major jeopardy. Policy makers and ordinary citizens alike have been misled, and everyone -- everyone -- is unprepared for the inevitable and massive coming oil price shock. An Oil Price Spike Would Burst The 'Everything Bubble'
Our thesis at Peak Prosperity is that the world’s equity and bond markets are enormous financial bubbles in search of a pin. Sadly, history shows there’s nothing quite as sharp and terminal to these sorts of bubbles as a rapid spike in the price of oil.
And we see a huge price spike on the way.
As a reminder, bubbles exist when asset prices rise beyond what incomes can sustain. Greece is a prime recent example. In 2008 when the price of oil spiked to $147/bbl, Greece could no longer afford imported oil. But oil is a necessity, so it was bought anyway, their national balances of payments were stressed to the point that they were exposed as insolvent and then their debt bubble promptly and predictably popped. The rest is history. Greece is now a nation of ruins and their economy might as well be displayed alongside the Acropolis.
What happened to Greece will happen to any and every financially marginal oil-importing nation. As a reminder, the U.S. still remains a net oil importer (more on that below).
Well, if you thought that world debt levels were dizzyingly high back at the beginning of the Great Recession in 2008, then you might want a fainting couch nearby before looking at this next chart:

(Click to enlarge)
(Source)
Global debt is a full $68 trillion higher in 2017 than it was in 2007(!). In terms of global GDP that represents a whopping increase of ~50 percent (from 276 percent to 327 percent).
At approximately 96 million barrels per day of oil consumption, each $10 rise in the price of oil per barrel means that oil consumers have to redirect an additional $960 million dollars each day(!) away from such things as profits, discretionary spending, and debt payments. Instead, that money is sent to the oil producers.
So, a future price shock that tacks on an addition $50/bbl to the current price (bringing the total price of oil back over $100/bbl) would translate into $4,800 million ($4.8 billion) per day. That's some $1.7 trillion per year of “redirected spending” that used to go to some other purposes but will now go to oil producers and oil producing nations.
Without belaboring the details, at the margin plenty of economically viable companies, countries and individuals would suddenly become ‘unviable’ and go bankrupt. Their debt and equity holders, employees, and communities that service these companies, will be wiped out.
This is why I love quoting Jim Puplava's observation that the price of oil is the new Fed Funds rate. It has more ability to determine the future of the economy than interest rates.
For example, if you want to bring credit growth into a screeching halt, just jack up the price of oil. That's exactly what happened in 2008.
And it can -- and very predictably will -- happen again.
For reasons I'll explain shortly (in Part 2), I project the next major upwards-surprise oil price spike to arrive somewhere between the second half of 2018 and 2020.
The Middle East Is Now A Lot More Volatile
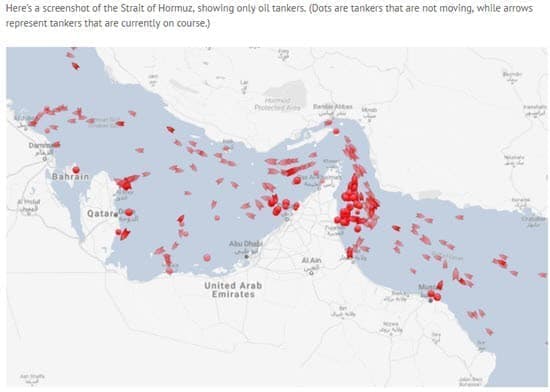
Now, if there’s a war in the Middle East that accelerates my timetable. Higher prices would arrive within weeks of the outbreak of hostilities, especially if they impact shipping traffic through the all-critical Strait of Hormuz.
As a quick reminder, roughly one third of all exported oil in the world passes through the Strait of Hormuz:
It’s a critical bottleneck. Even one missile flying towards one oil tanker will halt all oil shipments for quite some time.

(Click to enlarge)
Maritime insurers do not cover acts of war (see Rule 58) and the ship owners themselves will quickly stop shipments if it worried about taking massive losses on sunk tankers.
All of which means that the very first missile lobbed towards a vessel there will quickly result in no ships at all transiting the Strait.
(Click to enlarge)
(Source)
I raise this risk again here, as I did in my report on the recent concerning developments in Saudi Arabia, to remind everyone that an outbreak of war in the Middle East will prick the world’s global set of financial bubbles (stocks, bonds, real estate, fine art, etc) via a very sharp oil price spike.
Oil Economics
To get to the heart of the swindle being perpetrated, we only need understand a very simply equation describing the oil business. Money is spent drilling a hole in the ground, and then money is earned based on how much oil comes up out of that hole.
Money in, money out.
(Of course, there’s a lot of complexity involved in oil drilling and I don’t mean to diminish the incredible talents of the many gifted people who coax our energy out of the ground. But the high-level financial math isn't that hard to grasp.)
We can understand the oil industry's financial math using just three variables: C, P and A.
- C - the cost of drilling the well and then producing the oil.
- P – the price of oil when we sell it
- A – the amount of oil that comes out of the well.
The formula for profits is simply the (price of oil) times (the amount) minus (costs). (P * A) – C = profits
For example, let’s say that we spent $10 million drilling a well when oil commands a market price of $100 a barrel the entire time we’re selling it. The ‘break-even’ for that well -- i.e., when the money we spent was finally returned in full -- would be when C = (P * A).
So break-even would be 100,000 barrels in this example. 100,000 bbls * $100/bbl = $10 million.
If instead our well ultimately produced 200,000 barrels, we’d have a lot of profits. And of course, if we drilled a well that only produced 50,000 barrels, we’d lose money.
Now here’s where the swindle happens:
The cost to drill and operate the well (C)? That’s known with fine precision.
The amount of oil that will come out of that well, or A? That, too, is calculable and known.
But the price of oil (P) a driller receives for the oil it produces? Well, because that's an unknown it represents the major risk in the business. There's just no way to predict the future price of oil. So, what to do about this?
Well, one way to fix the price variable is to ask a different question than "how much will we make?" and instead ask "at what price of oil will our well break-even?" This is a firm, calculable number and it brings us to the heart of the swindle.
How Much Oil Do Shale Wells Really Produce?
If you’ve been following the US shale industry over the past few years, you're likely quite perplexed.
On one hand, the shale oil producers sport negative free cash flows in every year of operation. They are cash burning machines.
But on the other hand, their reported break-even prices have been falling dramatically, and are often reported to be well below the current retail price of oil. Meaning they should be nicely profitable.
Which is it?
How is it possible to both produce above your break-even price point and be losing money hand over fist?
Well, one way is if the reported break-even prices aren't correct. Let’s recall our simple formula for the break-even: C = (P * A).
When break-even prices are being reported in the media, what the companies are really doing is answering to this question: At what average price of oil will this well, once fully exhausted, have fully paid itself back?
It works like this. Suppose we knew a well costs $7 million to drill and operate over its lifetime, and we wanted to know what the breakeven price was. Well, that all depends on something called the EUR.
The total amount of oil that's projected to come out of a well over its lifetime (variable A in our equation) is called the Estimated Ultimate Recovery, or EUR.
The following table shows that the reported break-even might be anywhere from $70 to $9 if the EUR varied from a lifetime output of 100,000 barrels to 800,000 barrels:

(Click to enlarge)
So, clearly the EUR is a very important number. And not just for reported break-even costs to investors. Those EUR estimates form the basis for our expectations of how much oil is going to be produced from not only a given well, but from an entire shale basin, because the EUR's are baked into the production models.
In fact, they are the single most important number so getting them right, or close to right, is not just important, but absolutely critical.
Now let’s use that knowledge to read a recent article I came across in a prominent oil and gas journal. The entire article is centered on the Bakken play in North Dakota. In both tone and conclusions, it’s exactly similar to articles we might read about the other large shale plays like the Eagleford and Permian basins.
Related: Houthi Missile Targeting Riyadh Palace Intercepted
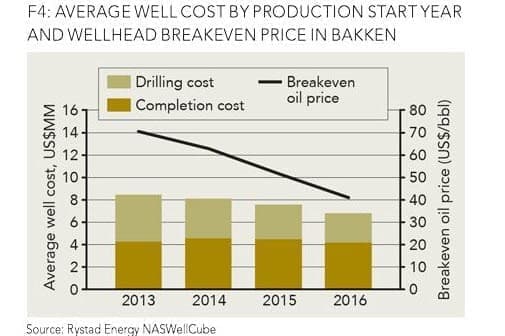
The average well cost for drilling and completing a well in 2016 is estimated at around US$6.8 million, with the potential for additional reductions by year-end.
Based on the current well cost estimates, the average wellhead breakeven price is expected to average US$40 per bbl for 2016, about a 20 percent reduction from the 2015 level.
This is a big achievement for shale companies operating in the Bakken; operators have managed to increase the average well performance while reducing well costs.
(Source)
Before we move onto the supporting charts from the article (below), let’s just note what we’ve read. The average breakeven is now just $40 per barrel, a whopping 20 percent reduction from 2016 (which also saw a huge reported reduction from 2015).
If you stopped reading there you’d probably think, “Cool! We’re figuring out better and faster ways to drill and unlock tons more oil. I guess all of those projections of a US shale production bonanza for many decades to come are confirmed by this news.”
The first chart offered in this article supports that contention very nicely. In it, we see that the break-even price has plummeted every year since 2013; going down from $70 to just $40. That’s amazing!
(Click to enlarge)
But a sharp eye would also notice that the drilling costs have not fallen nearly so much. They’ve only fallen around 17 percent per well while the break-even cost has collapsed by 42 percent.
What accounts for the difference? You already know, don’t you…it’s the EUR, the total amount of oil expected to come out of each well.
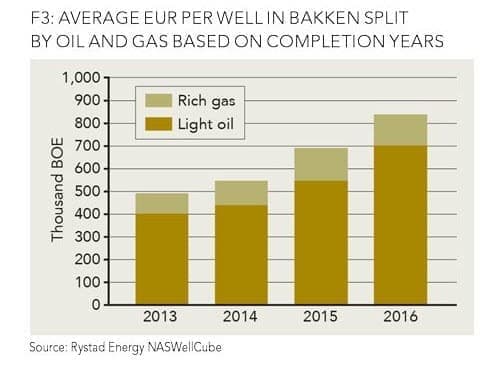
Here’s the supporting chart from the article:

(Click to enlarge)
Holy smokes! The EUR has climbed from 400,000 barrels to 700,000 barrels. That’s an increase of 75 percent!!
That one feature alone accounts for nearly all of the reported drop in the break-even case. Again, the casual reader would be forgiving for thinking, Cool! That confirms what I’ve been reading about all the amazing technological breakthroughs in horizontal drilling and fracking. We've got this!
Which brings us to… The Great Oil Swindle
Our commitment at Peak Prosperity is to find the data and let that tell us the story.
Fortunately, huge amounts of publicly available data exist on the production profiles of oil wells, right down to the monthly production values of each well. Gigantic data sets exist containing the results for thousands and thousands of wells, carefully sorted by vintage (year started) and precise location.
Even more fortunately, there are a few analysts out there that carefully download that data and then present it to the world, so we can form our own conclusions.
But much of that data is ignored or removed to make shale producers look healthier than they actually are. Here's a chart from the above article which has rather unhelpfully cherry picked the production data it used to make its point, but even with that attempt of duplicity, the chart still reveals the fraud:

(Click to enlarge)
The chart shows cumulative production over time. It paints a story saying that for each vintage year more oil seems to be flowing out of the ground. 2013 is the lowest, 2014 is better, and finally 2016 seems to be on track for the best year ever.
Why is this data unhelpfully presented? Because it stops at 18 months for each vintage even though we have many more years of data. These wells are principally depleted in 36 months, so why not show each vintage for 36 or more months, where possible? Is it because that might undermine the impression being conveyed, possibly?
Before we show that is indeed the case, just use your eyeballs and mentally carry those curves out. You can see them flattening even within the first 18 months. The EUR and the cumulative production become the same number at the end of a well’s life (at ~30 years, or 360 months). Can you mentally project any of those (asymptotic, flattening) curves ever reaching to 400,000 barrels on the y-axis? How about to 500,000? Could you make the case for 700,000?
To my eye, those puppies are flattening out. Even if I give them a generously long time, I can see them getting to maybe 300,000 to 350,000 -- tops.
Fortunately, we have more data to definitively address that question.
The first comes to us from Art Berman, who shows that when you allow the data from each vintage to run, you'll notice something quite obvious and very serious: faster initial rates of production cause faster rates of decline later on:

(Click to enlarge)
(Source)
While this chart is showing monthly production rather than cumulative production (stay with me on this…I know it takes some mental effort) it’s not hard to appreciate that a faster initial rate of production will add to the amount of oil coming out of a well while a steeper decline rate later will subtract from that value.
In other words, all of the fancy new technology and drilling techniques seems to only have accelerated the initial rate at which oil comes out of the ground, not the total amount!
Next, let’s again look at the cumulative production values, this time by vintage, or year. This data comes from the excellent website ShaleProfile.com run by Enno Peters who has done all that heavy lifting of the data and then gone the extra mile to make it easily graphed. Kudos Enno!
Shale wells deplete non-linearly. There’s some complexity there but it’s not too inaccurate for the layman to think that they deplete exponentially. Close enough to get you there.
Accordingly, when the daily and cumulative output of those wells are plotted on a log chart, the resulting decline "curves" become straight lines. To figure out how much oil is going to eventually come out of those wells over their lives, or the EUR, it is not too terribly inaccurate to simply extend a straight line through the data and see where it points.
When that's done for the Bakken wells we get this next chart:

(Click to enlarge)
(Source)
Every single oil well is plotted for every year between 2010 and 2015, broken into vintages of a quarter of a year each. That is, every well brought into production within a three-month window is lumped together and given a different color line.
Related: Saudi Arabia’s Big Oil Gamble
First, the blue dotted line that I've extended on the chart suggests that the most stellar vintage is on track to produce an EUR of roughly 300,000 barrels, give or take. The worst vintage might be expected to produce just 120,000 barrels.
To get to even 400,000 barrels (far less than the claimed 700,000 in the above article!) a very pronounced shift in the very best vintage would have to magically take place. No such ‘line shift’ has ever been seen in any of this data by myself and I’ve looked through a lot of it.
Remember, this is what is currently being widely reported for the Bakken right now:
(Click to enlarge)
There’s an enormous discrepancy between the above chart and the data we’ve got in hand and I’ve no good explanation for the difference except that they must come from different sources. My preferred data comes from the well head, but other’s take theirs from company presentations.
Why does any of this matter at all?
Because the inputs to a great many energy reports and if the actual data is correct, then every assumption about the future prospects of the US as an oil producer are wildly, dangerously wrong.
For example, if the EURs are half what is being assumed, which seems likely, then every future oriented analysis depending on them will be overstating things by 100 percent. A 2x error seems pretty significant to me.
For those who like their data, you could also read Art Berman who has done a similar (and far more sophisticated) analysis of the Permian basin and come to precisely the same conclusions (also deriving EURs roughly half of what’s being claimed).
Or this analysis of the Eagleford basin which derived an EUR of 250,000:
This study derives typical production curves of tight oil wells based on monthly production data from multiple horizontal Eagle Ford shale oil wells. Well properties initial production (IP) rate and production decline rate were documented, and estimated ultimate recovery (EUR) was calculated using two empirical production decline curve models, the hyperbolic and the stretched exponential function.
IP = 500 bbl/day, D = 0.3 and b = 1 resulting in an EUR of 250 kbbl with a 30-year well lifetime, however, with the recognition that this extrapolation is uncertain.
(Source)
Each of these analyses are pointing to EUR’s that are in the range of 250,000 to 350,000 barrels and across every shale basin.
The Danger Of This Deceit
The summary is we have lots and lots of actual data and supporting studies all pointing to the idea that the amount of oil that will come out of these shale wells is half or less what’s being popularly reported.
By Zerohedge
More Top Reads From Oilprice.com:
- Is Premium Gasoline A Waste Of Money?
- Hedge Funds Bullish On Oil For 2018
- Oil Market On Edge Following Outages


The large decrease in reported break evens isn't directly a function of the 700kbbl EUR estimate because that's not what companies are using. For example if the average drilling and completion cost is 6.8 million, a wellhead breakeven price of $40 would need production of only 170kbbl. Add in service costs over time and administrative costs and you might need 250-300kbbl.
Companies complain the EIA and IEA are overestimating future production by underestimating well decline rates, and they are right.
As a keen observer of the global oil market, I have noticed a connection between rising oil prices and claims of increases in US shale oil production and a build-up of US oil stocks.
Every time the oil prices show signs of rising, the EIA announces either increases in US shale oil production or a huge build-up in US oil stocks or both with the aim of dampening the oil price.
A build-up of US oil stocks can only happen in one of three ways. One if US oil production exceeds domestic consumption. This is not the case otherwise the US would not be importing 7-8 million barrels a day (mbd). The second is if the US is taking advantage of low oil prices to build up its stocks. If this is the case, then the increased imports should push the price up. The third way is if US domestic oil and gasoline demand is declining. This is not true either since gasoline demand for the period ending July 2017 at 9.87 mbd broke all previous records.
As for the oil prices, I don't agree with you on the dire consequences of rising oil prices even if they reach $100/barrel. While low oil prices provide a short-term stimulus to the global economy, they force companies to reduce investments globally , sell some of their productive assets and make thousands if not millions of people redundant.
Dr Mamdouh G Salameh
International Oil Economist
Visiting Professor of Energy Economics at ESCP Europe Business School, ondon
Suggesting that money evaporates as the price of oil rises is a false statement.
Oil producers around the world today share objectives. Before the American energy renaissance, the US economy was brought to brink of extinction. Could you imagine the destruction of our economy in the wake of 2008 WITHOUT SHALE OIL AND GAS? Our sovereignty would be assuredly destroyed by now and the middle class single digit percentages of households.
America can no longer be economically constrained and held hostage by foreign Middle East dictatorships and the globalist agenda and our nefarious elected officials. Strong US leadership and a secure supply of domestically harvested coal, natural gas, and oil allow for global peace to have a chance. If you are worried about the world you will leave behind, ask yourself, how do I feel about leaving 20 trillion in unpayable IOUs, for decades of nonsensical government gone wild? You got it, 10s of trillions of waste, fraud, corruption, 75,000 Americans died from opioid OD in a year (more than the entirety of soldiers lost in the military industrial complex inspired Vietnam War), trafficking humans, money laundering, stealing money, horrible health insurance, phony pharma, 5 banks and a communist agenda in our education system starting at PRE K. Thanks Lefties!
Redistributing wealth from the US to outside the US in pursuit of uneconomical, unaffordable, rigged, inefficient and hazardous renewable sources is part of the failure of globalism. I am sorry, there are far greater hazards to the health of humanity and it’s not the climate changing, it’s the global climate engineering.
No person or group of people have any idea how much oil is recoverable in any part of the world because technological rates of change the price will determine what quantity is ultimately recovered. Until the as yet undisclosed or unknown technology is revealed to humanity, a combustion engine for transportation, coal for your light bulb, and natural gas for your heat, will remain the primary mechanisms through which the world can attain and sustain peace and widely distributed prosperity.