


The views expressed in this post are those of the author alone.
This assessment is based on the data in the 2017 BP Statistical Review of World Energy available here. As such it uses that review’s definition of oil which is crude and condensate and natural gas liquids, uncompensated for their different energy contents or values of refined product components.

(Click to enlarge)
Figure 1: World Oil Production 1990 – 2017
This analysis was prompted by a chart by Ovi showing that Non-OPEC production less Russia, Canada and the United States has been in decline since 2004. That decline rate is 0.25 million barrels/day/annum. It had previously risen strongly from 1990.
(Click to enlarge)
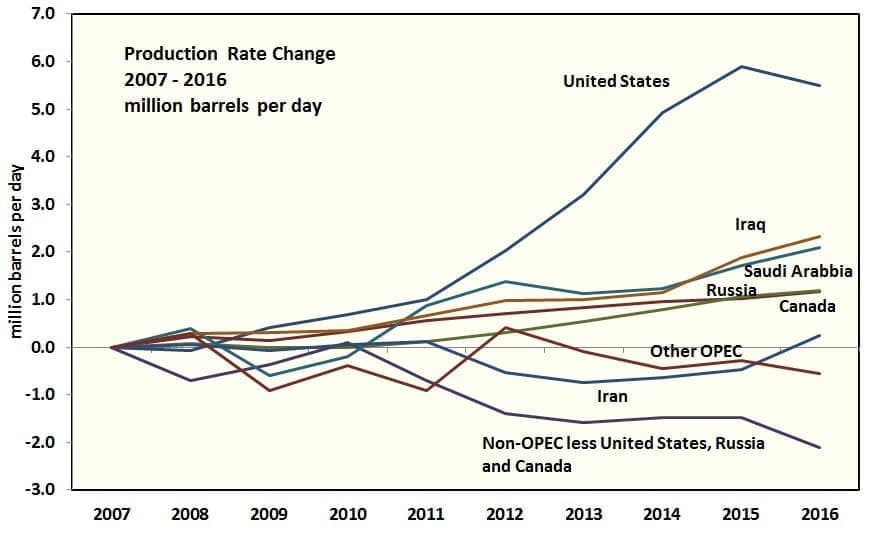
Figure 2: Production Rate Change 2007 – 2016
The United States LTO patch is widely credited with having caused the oil price collapse of 2014. American production had risen by six million barrels per day since 2007. The United States was not alone with four other countries totaling six million barrels per day of production increase. Iraq and Saudi Arabia contributed two million barrels per day each with Russia and Canada contributing one million barrels per day each.

(Click to enlarge)
Figure 3: World Oil Consumption 1990 – 2016
OECD consumption has been flat even as OECD countries have had an increase in GDP.

(Click to enlarge)
Figure 4: Where the Oil Went
The fall of non-OECD consumption from 1990 to 1996 was due to the dissolution of the Soviet Union. Since then consumption growth has been steady at about 835,000 barrels/day/annum. Chinese consumption growth was 240,000 barrels/day/annum up to 2002 and then steepened to 512,000 barrels/day/annum since. OECD consumption growth was strong up to 2007 and then demand contracted due to higher oil prices. From here it looks like OECD consumption has plateaued. China may have also plateaued. Non-OECD consumption is likely to continue rising with a large part of that being due to India.

(Click to enlarge)
Figure 5: World Oil Production from 1990 with a Projection to 2025
Related: The Man Behind The Oil Price Rally
This projection is based on U.S. conventional production resuming long term decline and U.S. LTO production continuing to climb, driven by the Permian Basin. Russian production is in a long plateau. Canadian production continues its slow, capital-intensive climb. Other non-OPEC production continues its established decline of 0.25 million barrels/day/year. Iraqi production rises by 2.0 million barrels/day to 2025. It could be higher than that. Other OPEC production had risen by 3.0 million barrels/day from 2000 to 2005, in response to the lifting of production restrictions, and has been in a plateau since. The projection assumes a decline of 0.3 million barrels/day/year.
The projection shows a gap of about eight million barrels per day by 2025 relative to the established growth rate indicated by the dashed line. This could largely be filled if Permian Basin production ramps up faster than projected and Iraqi production growth ramps up faster than projected now that their civil war is over.
In summary, the market is likely to remain in balance and sustained price excursions are unlikely.
By Peak Oil Barrel
More Top Reads From Oilprice.com:
- Shale Growth Hides Underlying Problems
- Are NatGas Prices About To Explode?
- Panama Canal Can’t Handle U.S. LNG Boom


