U.S. West Texas Intermediate is in a position to post a strong gain this week. The short-term fundamentals continue to be supportive as bullish traders remain concerned over the escalating military activity in the Middle East and shrinking global oil inventories.
Earlier in the week, crude oil surged to the upside after Saudi Arabia said it intercepted missiles over Riyadh and U.S. President Trump warned of military action in Syria.
In another bullish development on Thursday, OPEC said that a global oil stocks surplus is close to evaporating. The cartel supported its claim by saying it was based on healthy energy demand combined with its own supply cuts. Furthermore, it revised up its forecast for production from rivals who have benefited from higher oil prices.
Additionally, OPEC Secretary-General Mohammad Barkindo told Reuters in an interview that OPEC and its oil producer allies are poised to extend their supply-cutting pact into 2019 even as a global glut of crude is set to evaporate by September.
In other news, the U.S. Energy Information Administration said U.S. crude inventories rose by 3.3 million barrels to 428.64 million barrels. Additionally, U.S. crude oil production last week hit a fresh record of 10.53 million barrels per day (bpd), up by a quarter since mid-2016. The rise in production means the U.S. now produces more crude than top exporter Saudi Arabia. Only Russia, at currently just under 11 million bpd, pumps out more.
The price…
U.S. West Texas Intermediate is in a position to post a strong gain this week. The short-term fundamentals continue to be supportive as bullish traders remain concerned over the escalating military activity in the Middle East and shrinking global oil inventories.
Earlier in the week, crude oil surged to the upside after Saudi Arabia said it intercepted missiles over Riyadh and U.S. President Trump warned of military action in Syria.
In another bullish development on Thursday, OPEC said that a global oil stocks surplus is close to evaporating. The cartel supported its claim by saying it was based on healthy energy demand combined with its own supply cuts. Furthermore, it revised up its forecast for production from rivals who have benefited from higher oil prices.
Additionally, OPEC Secretary-General Mohammad Barkindo told Reuters in an interview that OPEC and its oil producer allies are poised to extend their supply-cutting pact into 2019 even as a global glut of crude is set to evaporate by September.
In other news, the U.S. Energy Information Administration said U.S. crude inventories rose by 3.3 million barrels to 428.64 million barrels. Additionally, U.S. crude oil production last week hit a fresh record of 10.53 million barrels per day (bpd), up by a quarter since mid-2016. The rise in production means the U.S. now produces more crude than top exporter Saudi Arabia. Only Russia, at currently just under 11 million bpd, pumps out more.
The price action on Friday strongly suggests that investors are not paying too much attention to the U.S. inventories numbers, but rather to the events in Saudi Arabia and Syria.
Concerns over military strikes against Syria are expected to continue to underpin crude oil prices into the close on Friday. This is because comments from President Trump and the White House seemed to indicate the U.S military could remain active in the area. This leaves open the possibility of another bombing raid over the week-end.
President Trump met with his national security team on Thursday to discuss the situation in Syria, but did not make a final decision on whether or not to use military force, White House Press Secretary Sarah Sanders said.
“We are continuing to assess intelligence and are engaged in conversations with our partners and allies,” Sanders said in a release.
Although Trump was expected to talk with French President Emmanuel Macron and British Prime Minister Theresa May, CNBC is reporting that the U.S. was considering striking eight potential targets. Those targets include two Syrian airfields, a research center and chemical weapons facility.
Earlier in the week, Trump broke protocol about a potential U.S. air strike against Syria by Tweeting, “Get ready Russia, because they will be coming, nice and new and ‘smart!’ You shouldn’t be partners with a Gas Killing Animal who kills his people and enjoys it.”
We’re looking at a news driven market which could change at any time. This makes the monthly chart an important tool to use during this volatile time period.
With crude oil prices hitting highs we haven’t seen February 2015, it is a good time to take a look at the longer-term charts in what is known as top-down analysis.
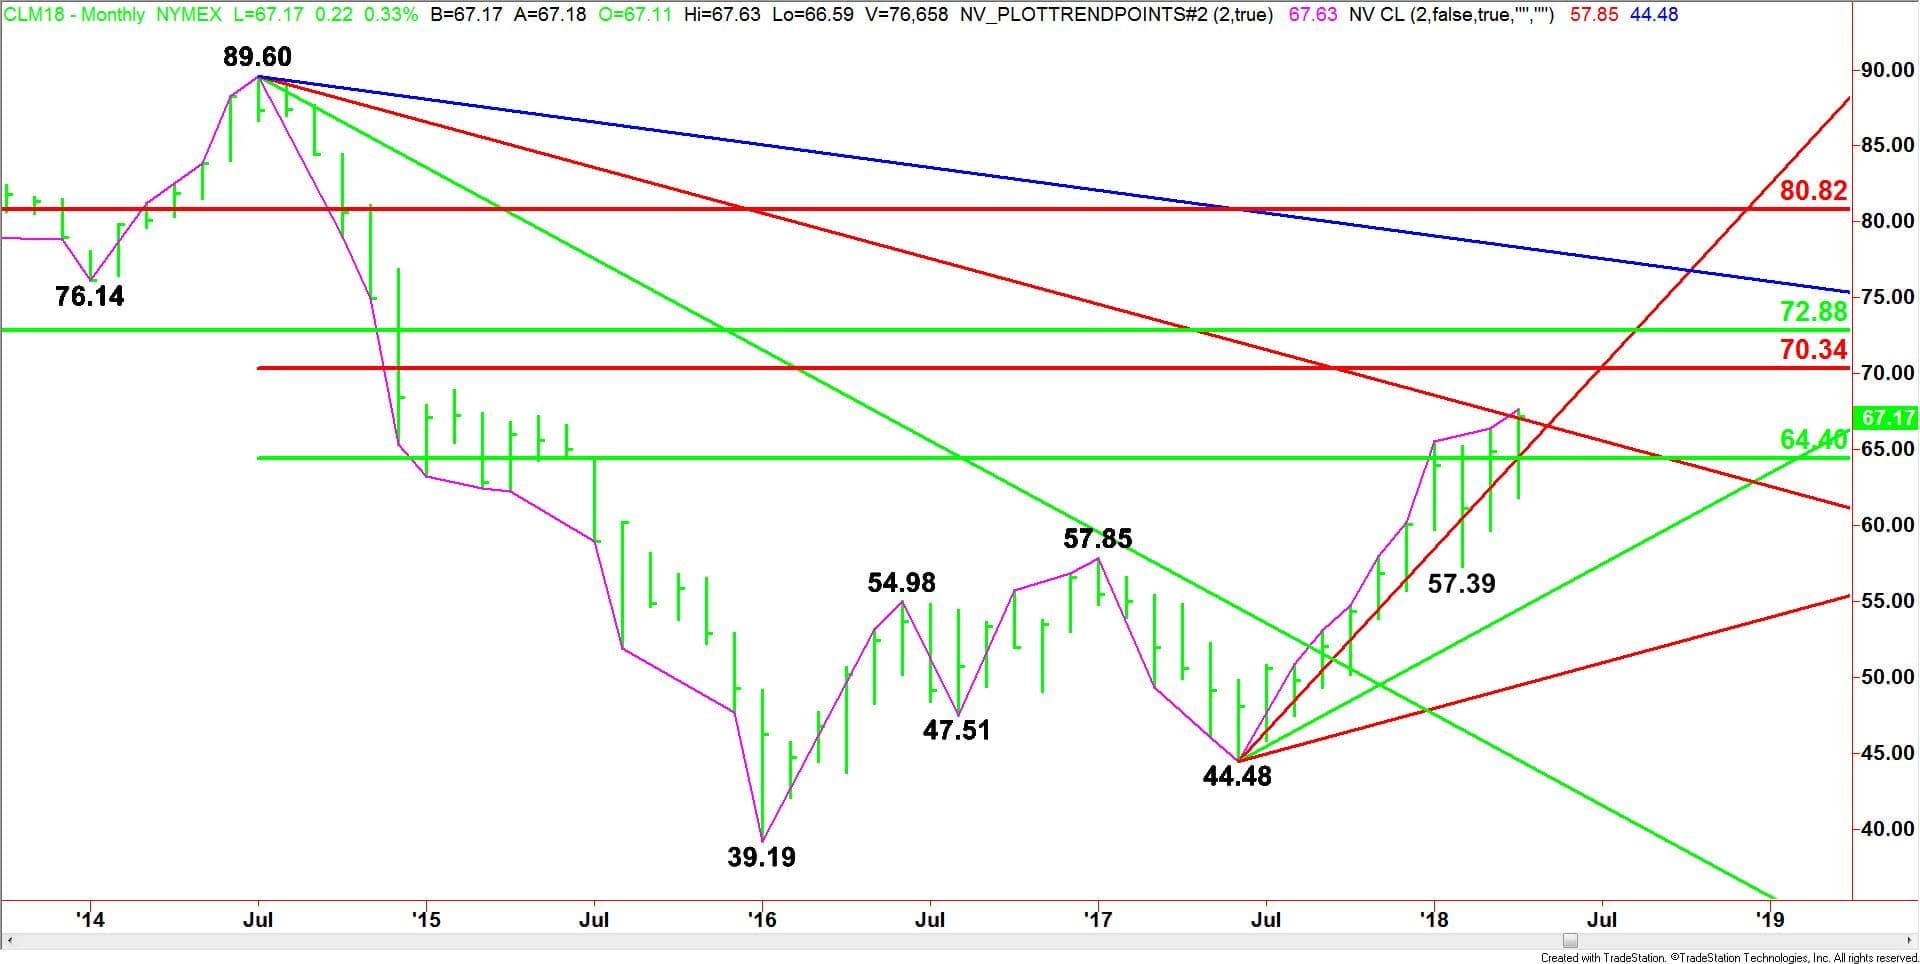
Monthly June West Texas Intermediate Crude Oil Technical Analysis

(Click to enlarge)
The main trend is up according to the monthly swing chart. The main trend turned up in November 2017 when buyers took out the previous main top at $57.85. This corresponded with the OPEC-led group’s decision to extend the first agreement to cut production into 2018.
After swinging down to $57.39 during February 2018, crude oil recovered enough to reach its highest level since February 2015 this week.
This week’s price action confirmed the minor bottom at $57.39. A trade through this level will change the minor trend to down.
The main range is formed by the April 2011 top at 106.56 and the January 2016 bottom at $39.19. Its 50% to 61.8% retracement zone at $64.40 to $70.34 is the primary upside target.
The intermediate range is formed by the July 2014 top at $89.60 and the January 2016 bottom at $39.19. Its retracement zone at $64.40 to $70.34 is currently being tested.
These two zones are controlling the longer-term direction of crude oil prices. The combination of the two zones makes $70.34 to $72.88 the most important target.
Monthly June West Texas Intermediate Crude Oil Technical Forecast
Not only is the trend up on the monthly chart, but the daily and weekly charts are also experiencing a strong upside bias.
In addition to the monthly swing chart, the market is also testing a pair of Gann angles.
Since the bottom at $44.48 in June 2017, crude oil has been averaging gains of $2.00 per month. It has been following an uptrending Gann angle for 10 months. This angle comes in at $64.48 in April. This angle is the support.
The market is also testing a downtrending Gann angle from the July 2014 main top at $89.60. This angle, moving down at a rate of $0.50 per month is at $67.10. This angle is currently being tested.
A combination of the uptrending Gann angle at $64.48 and the 50% level at $64.40 forms a support cluster. This is the major support during April. A sustained move over this support cluster will help maintain the upside bias.
Taking out the downtrending angle at $67.10 and sustaining the move will indicate the buying is getting stronger. If this move generates enough upside momentum then the rally could extend into the Fibonacci level at $70.34.
The Fib level at $70.34 is the trigger point for an extension into the 50% level at $72.88. This price is the trigger point for an even steeper acceleration to the upside.