This week’s price action in the crude oil, unleaded gasoline and natural gas markets had one thing in common. They all featured the return of volatility. Both the fundamentals and the technical chart patterns all indicate that volatility is likely to remain high over the near-term.
Crude Oil
The week began with January West Texas Intermediate crude oil futures underpinned by expectations that the OPEC-led agreement to cut production would be extended beyond the March 2018 deadline. This event has been driving the market higher for several weeks.
Last week, we raised concerns about whether speculators would be able to sustain the rally since OPEC and the other major producers including Russia would not be making a decision on the extension until November 30 when the group meets in Vienna, Austria.
We were primarily concerned that the hedge funds and commodity money managers would exhaust their buying spree before the date. In other words, it would turn into a “buy the rumor, sell the fact situation.”
Concerns were eased a bit early this week when prices surged to the upside due to geopolitical events in the Middle East. Major arrests in Saudi Arabia due to a crackdown on corruption and an escalation of tensions between Saudi Arabia and Iran helped drive prices to nearly a two-year high.
These events contributed to the first shot of increased volatility. The second phase was generated by a mixed government inventories report.
According…
This week’s price action in the crude oil, unleaded gasoline and natural gas markets had one thing in common. They all featured the return of volatility. Both the fundamentals and the technical chart patterns all indicate that volatility is likely to remain high over the near-term.
Crude Oil
The week began with January West Texas Intermediate crude oil futures underpinned by expectations that the OPEC-led agreement to cut production would be extended beyond the March 2018 deadline. This event has been driving the market higher for several weeks.
Last week, we raised concerns about whether speculators would be able to sustain the rally since OPEC and the other major producers including Russia would not be making a decision on the extension until November 30 when the group meets in Vienna, Austria.
We were primarily concerned that the hedge funds and commodity money managers would exhaust their buying spree before the date. In other words, it would turn into a “buy the rumor, sell the fact situation.”
Concerns were eased a bit early this week when prices surged to the upside due to geopolitical events in the Middle East. Major arrests in Saudi Arabia due to a crackdown on corruption and an escalation of tensions between Saudi Arabia and Iran helped drive prices to nearly a two-year high.
These events contributed to the first shot of increased volatility. The second phase was generated by a mixed government inventories report.
According to the U.S. Energy Information Administration, U.S. crude oil stockpiles rose unexpectedly during the week-ending November 3. The move was fueled by a jump in imports and a plunge in exports. U.S. production also hit its highest level since at least 1983.
Crude inventories rose 2.2 million barrels versus estimates for a 2.9 million barrel draw down. Gasoline and distillate inventories fell to multi-year lows, even as refining rates rose.
The EIA also said domestic crude production rose 67,000 barrels per day to 9.62 million bpd.
The crude oil portion of the EIA report was bearish, but the product components were bullish.
As we approach the end of the week, traders are faced with a huge dilemma. They are going to have to decide whether to buy strength in anticipation of an extension of production cuts, or wait for a pullback into a value area in reaction to rising U.S. production. These are the issues that could cause the next wave of volatility.
Furthermore, an escalation of tensions in the Middle East could trigger a surge to the upside, while an increase in the number of producing oil wells in the U.S. could drive prices sharply lower, for example. Of course, the best of both worlds for the bullish traders will be increased tensions and additional cuts in the number of producing wells.
Crude Oil Technical Analysis

(Click to enlarge)
Simple analysis tells us that the main trend is up according to the weekly swing chart. A trade through $58.21 will reaffirm the uptrend. This could trigger an acceleration to the upside into the psychological $60.00 level.
The main range is $46.95 to $58.20. If the market begins to weaken then we could see a correction into its 50% to 61.8% retracement zone at $52.58 to $51.25. This zone is the primary downside target and value zone. Since the main trend is up, new buyers are likely to show up on a test of this zone.
The chart pattern clearly suggests that investors have the option to continue to buy strength, or play for a pullback into support. This is a personal preference, but their decision will likely be determined by whether the situation in the Middle East escalates enough to cause a supply disruption, or whether U.S. production increases further, giving investors an excuse to begin taking profits. This could generate the downside momentum needed to drive the market into the support zone.
Unleaded Gasoline
As mentioned earlier, this week’s EIA report was mixed, bearish for crude oil and bullish for the products.
Gasoline stocks fell 3.3 million barrels to 209.5 million barrels, their lowest since November 2014. Traders were looking for a 1.9 million barrel draw down.
Distillate stockpiles, which include diesel and heating oil, fell 3.4 million barrels, more than double than the expected 1.4 million-barrel drop, the EIA data showed. At 125.6 million barrels, nationwide distillate inventories were at their lowest since February 2014.
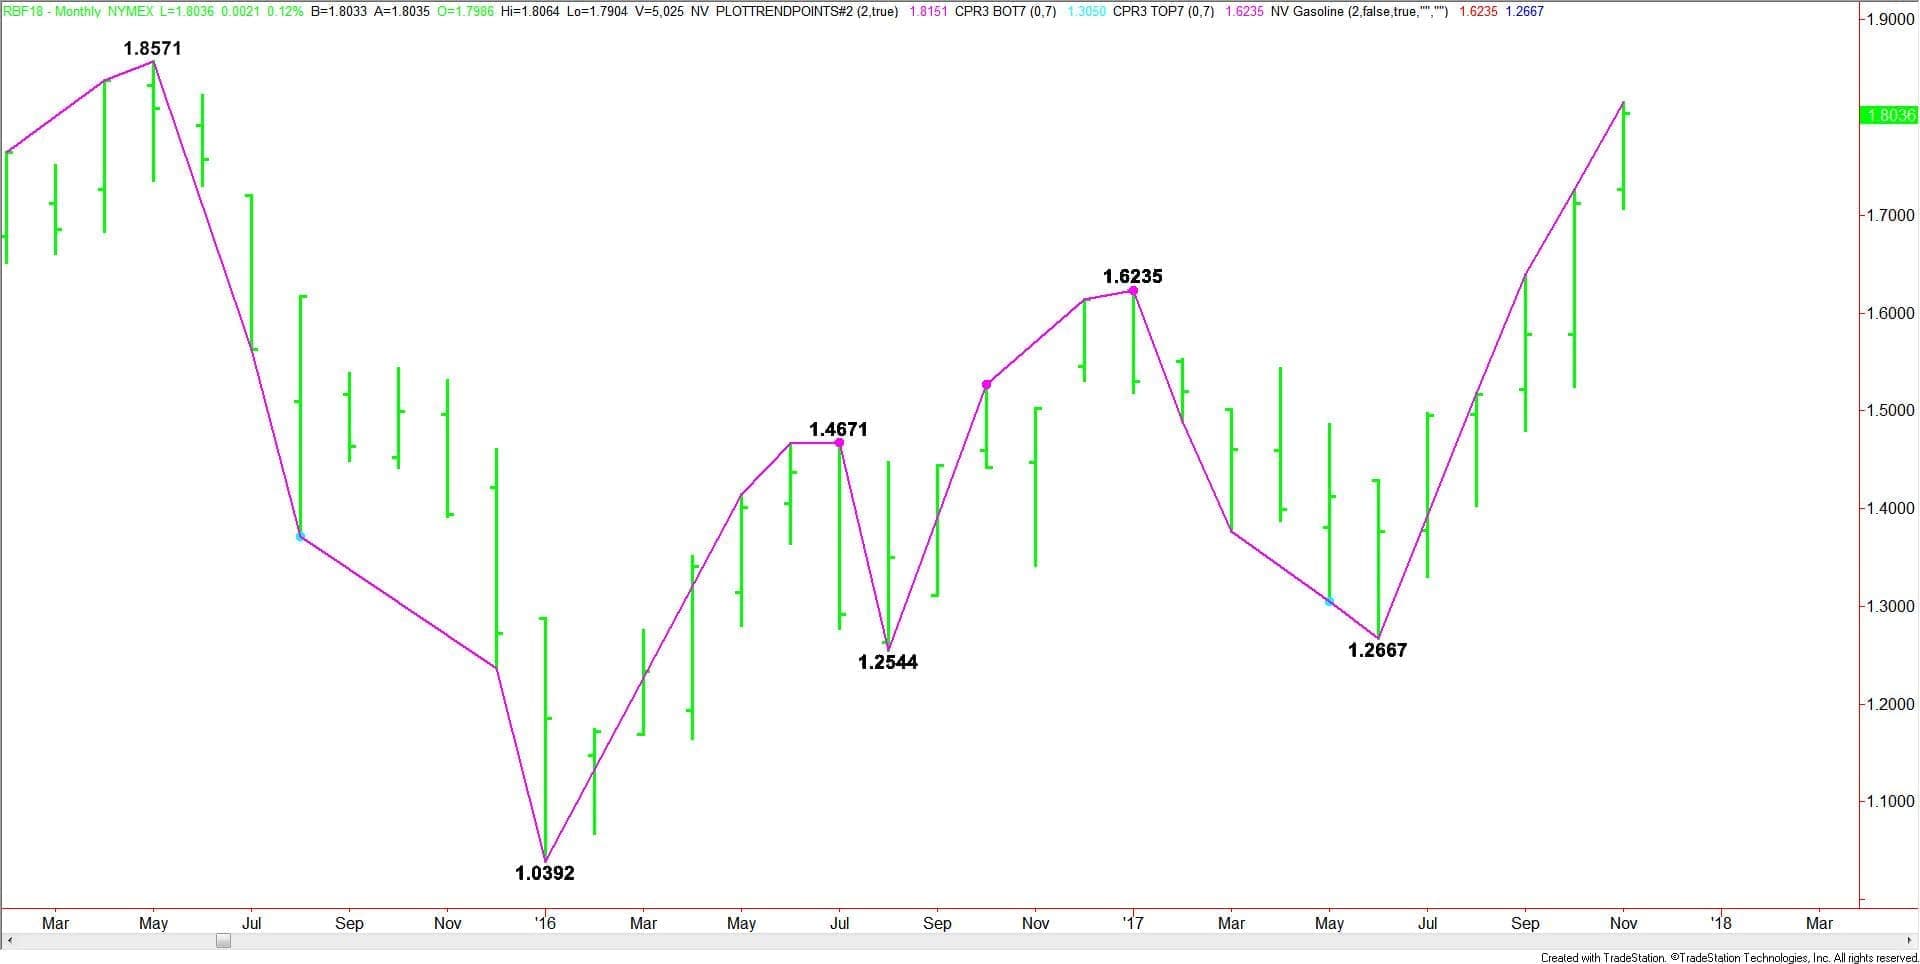
Unleaded Gasoline Technical Analysis
(Click to enlarge)
The main trend is up according to the monthly swing chart. This week’s strong upside momentum has put the market in a position to test a multi-year high at $1.8571. This price may be the trigger point for an even stronger breakout to the upside.
Natural Gas
January Natural Gas gapped higher last Monday, setting in motion a strong short-covering rally. The catalyst behind the rally was a forecast for below average temperatures in key heating demand areas.
Although temperatures are forecast to return to average to above average temperatures from early next week to Thanksgiving on November 23, last week’s price action may have officially signaled the start of the winter heating season which may mean we’ll be looking at an upside bias for several months.
Natural Gas Technical Analysis
(Click to enlarge)
The main trend is down according to the weekly swing chart. However, the price action suggests that momentum may be shifting to the upside. The main trend will change to up if buyers can take out $3.450. The downtrend will resume on an extended move through $2.983.
The main range is $2.720 to $3.829. Its retracement zone is $3.275 to $3.144. The market tried to establish support inside this zone from June through mid-October. However, this plan collapsed when sellers drove the market well under this zone to $2.983.
In hindsight, this sharp break looks like exhaustion, or the point in time when the last of the long investors finally decided to get out of the market. The subsequent turnaround suggests that short-sellers are covering as the speculative buying is increasing.
Crossing to the strong side of the retracement zone at $3.275 to $3.144 suggests the market is strengthening.
The short-term range is $3.829 to $2.983. If the upside momentum continues to increase then we should see a test of its retracement zone at $3.406 to $3.506. A test of this zone will also mean the trend has turned up.
If the trend turns up then buyers are likely to come in on the dips and this should start a meaningful rally.
Because of the retracement zones, natural gas is still in a position to post a choppy, two-sided trade over the near-term. However, if it can build a support base over $3.275 to $3.144 then I think it will be safe to say that the bottom is in and that all it’s going to take is a lingering cold snap to drive prices sharply higher.