


The OPEC charts below were created with data from the OPEC Monthly Oil Market Report. The PDF File can be downloaded from here: OPEC MOMR All OPEC data is through April 2018 and is in thousand barrels per day.
(Click to enlarge)
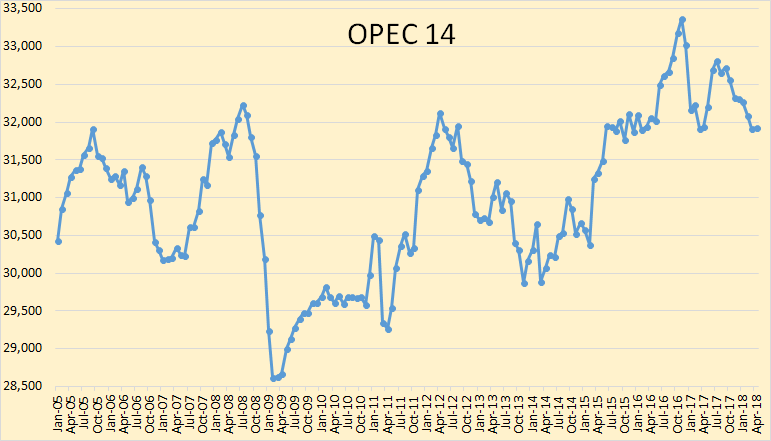
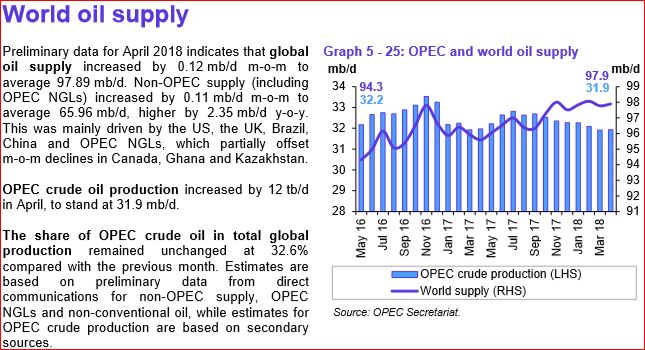
There was little change in OPEC production in April.
(Click to enlarge)
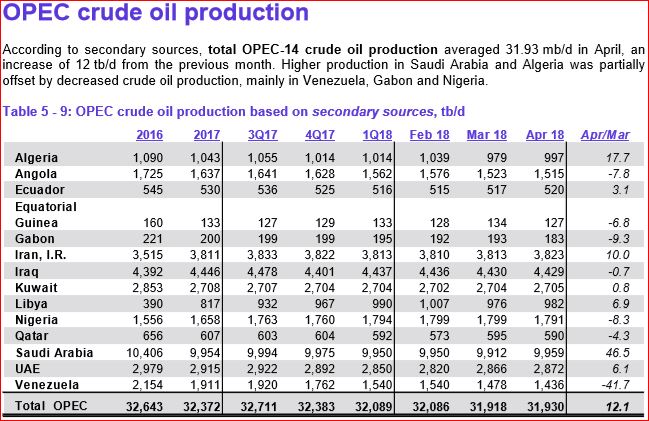
OPEC production was up 12,000 barrels per day in April but that was after February production had been revised down by 74,000 bpd and March production revised down by 39,000 bpd.
(Click to enlarge)
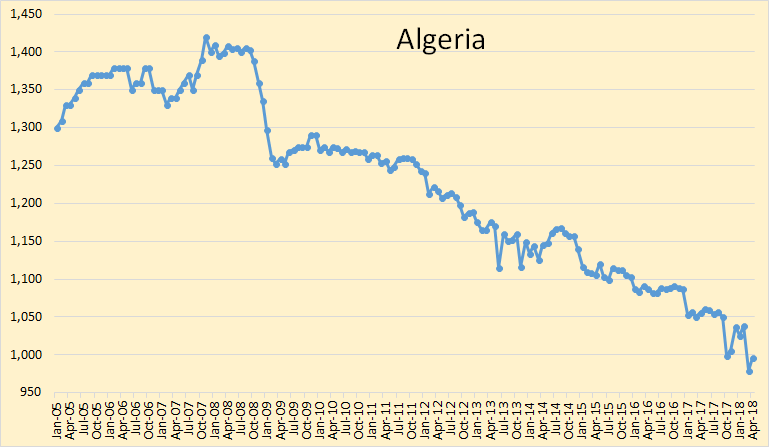
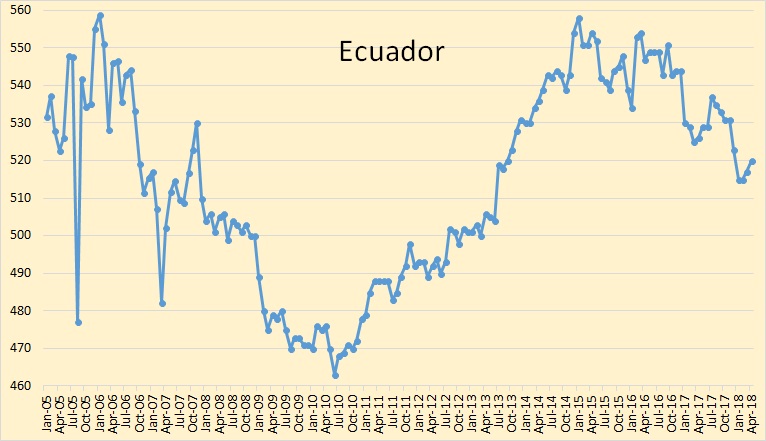
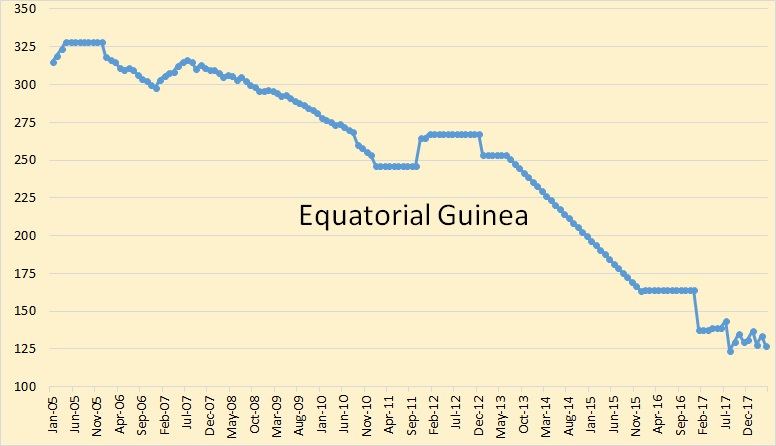
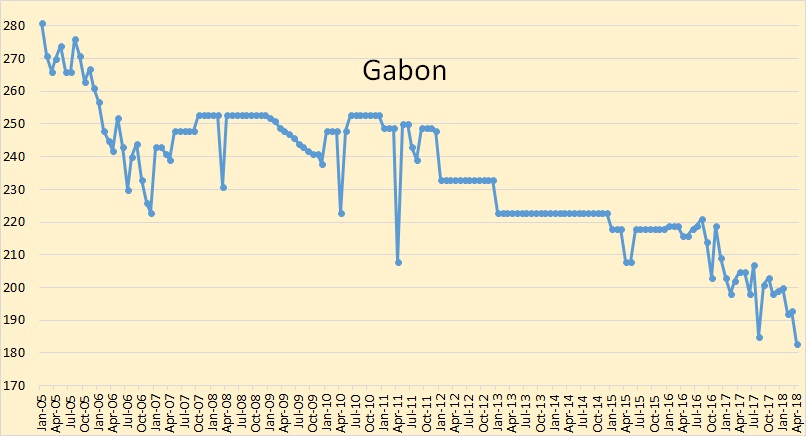
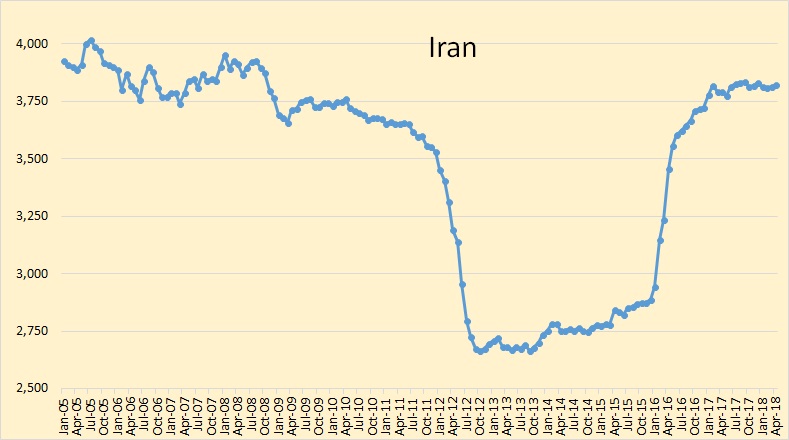
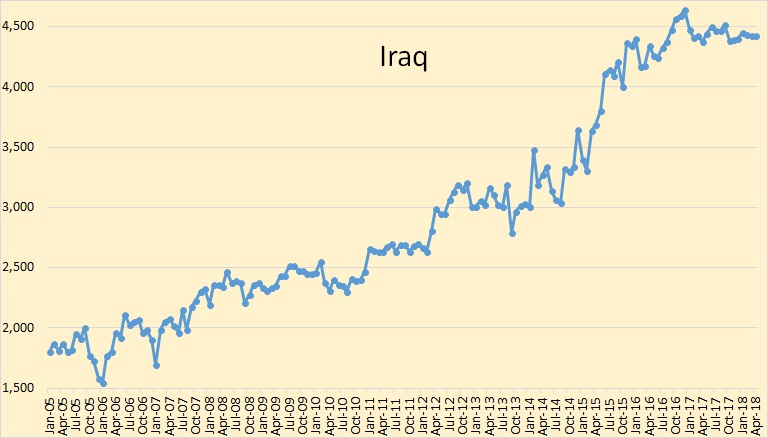
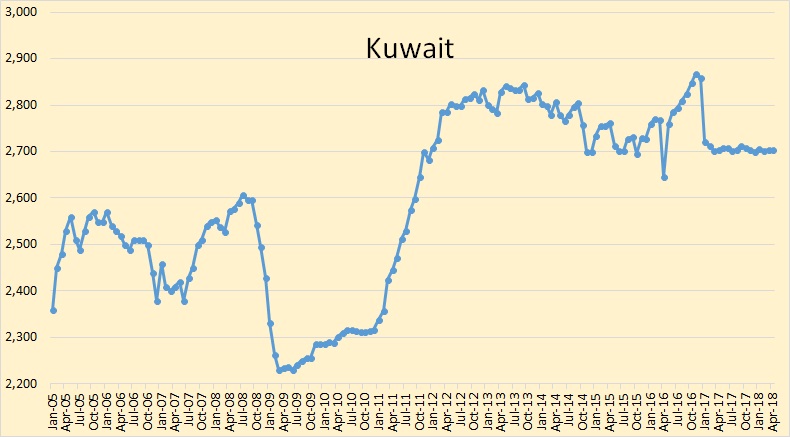
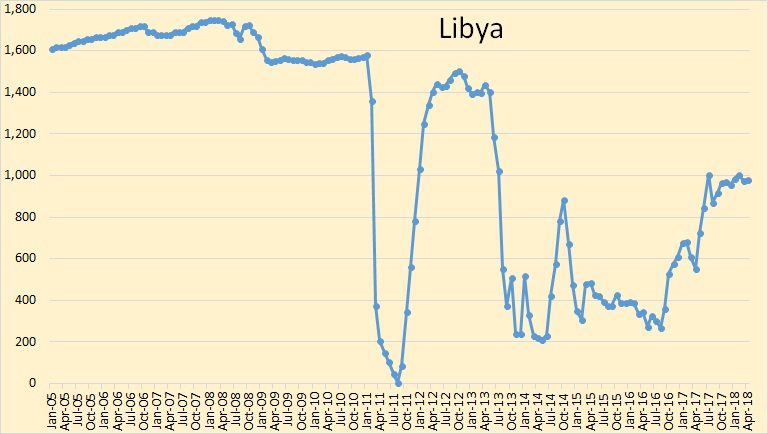
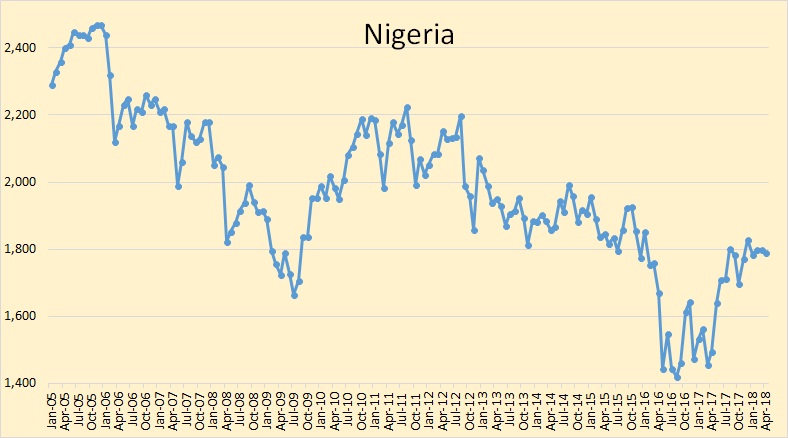
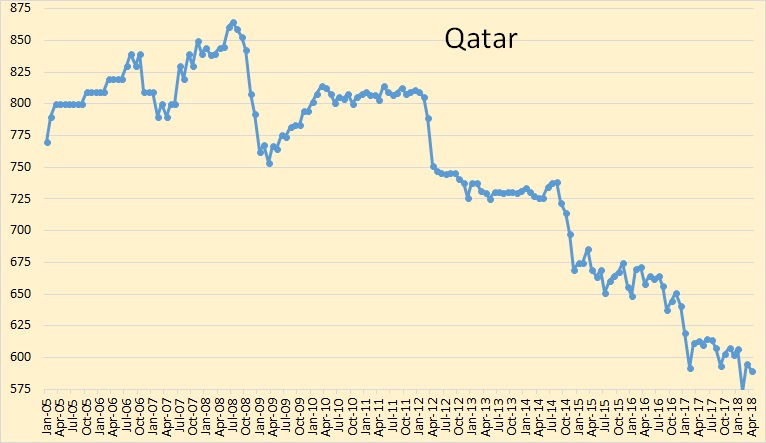
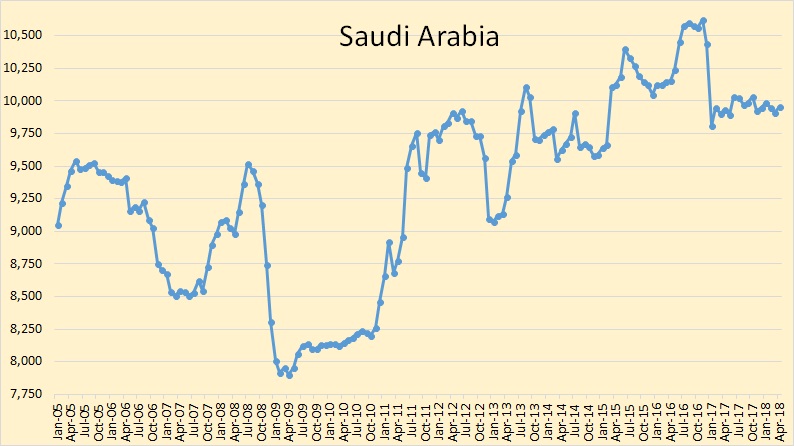
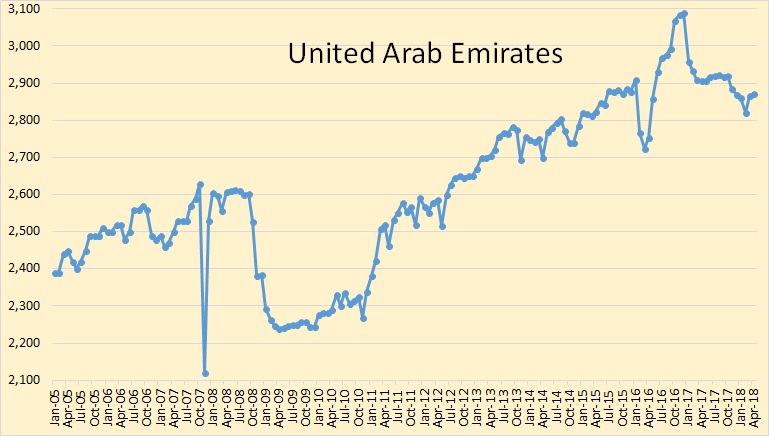
I am going to forgo commenting on each country unless there is something dramatic happening.
(Click to enlarge)
(Click to enlarge)
(Click to enlarge)
(Click to enlarge)
(Click to enlarge)
(Click to enlarge)
(Click to enlarge)
(Click to enlarge)
(Click to enlarge)
(Click to enlarge)
(Click to enlarge)
(Click to enlarge)
(Click to enlarge)
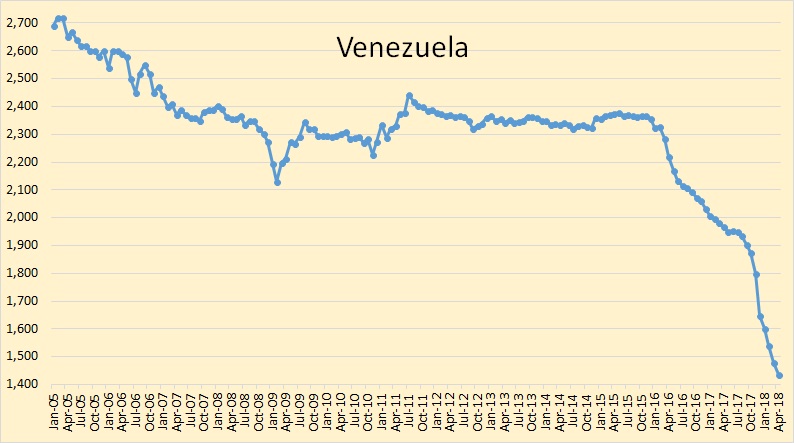
The collapse continues in Venezuela. Since September 2017, the decline has averaged 63,000 barrels per day per month. The two years prior to that date the decline had averaged less than 20,000 barrels per day per month.
(Click to enlarge)
OPEC has total liquids at 97,890,000 barrels per day. The EIA has C+C, for the last six months that they have data, about 16,500,000 barrels per day below that figure. I wonder how accurate that figure is for total NGLs?
(Click to enlarge)
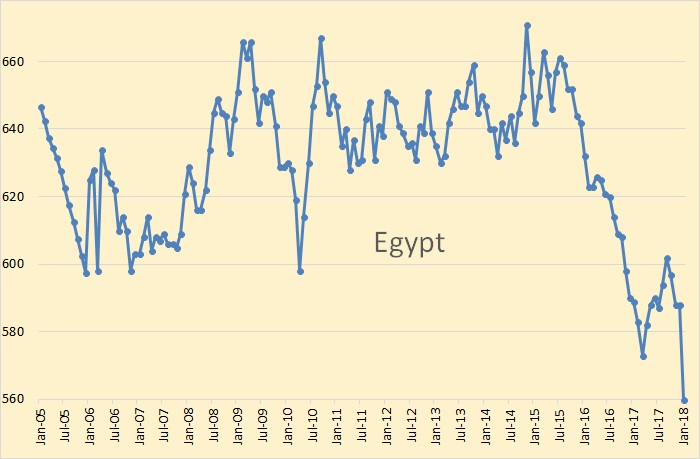
Egypt is not an OPEC member. This data is from the EIA and is through January 2018.
(Click to enlarge)
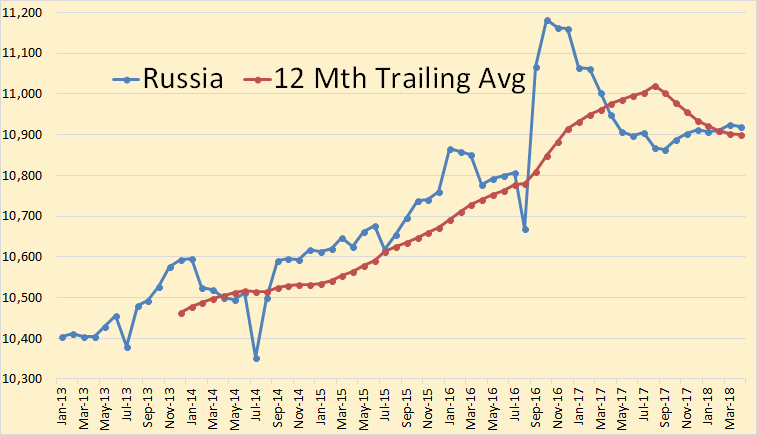
The data here is from the Russian Minister of Energy and is through April 2018. It is crude+condensate. Production in April was almost flat, down 5,000 bpd. Data from the Russian Minister of Energy averages about 400,000 barrels per day above what the EIA reports for Russia.
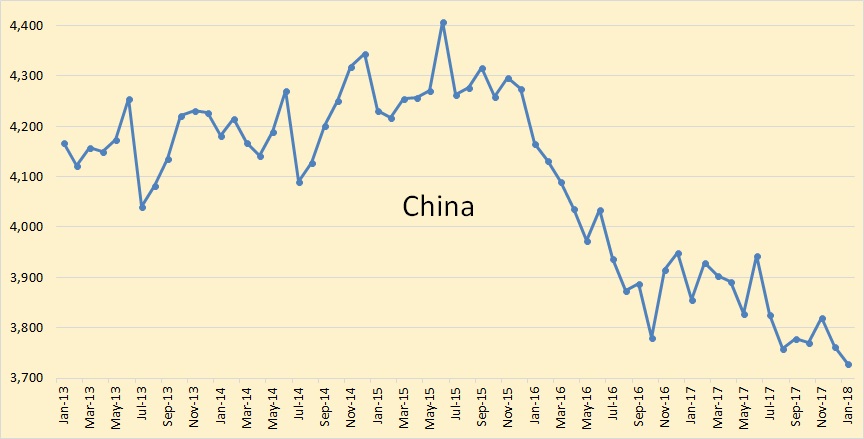
All the following data is from the EIA and is through January 2018.
(Click to enlarge)
There is no doubt that China has peaked. It is also consuming a lot more oil. So as production goes down imports will go up a lot faster.
(Click to enlarge)
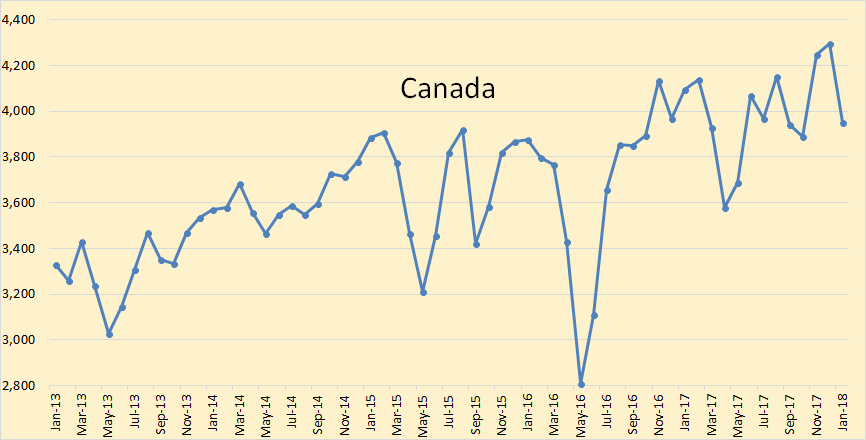
The EIA says Canadian C+C production was down 348,000 bpd in January.
(Click to enlarge)
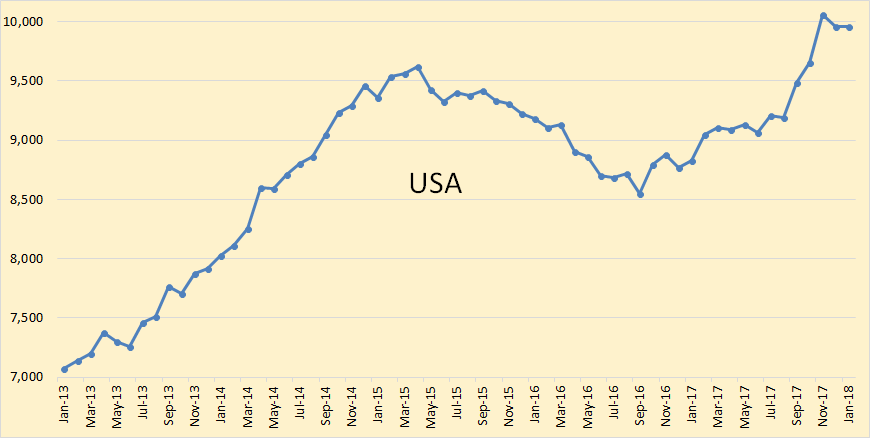
U.S. C+C production was up only slightly in January, 6,000 bpd, but still down 102,000 bpd from an all-time high of 10,066,000 barrels per day in November 2017.
(Click to enlarge)
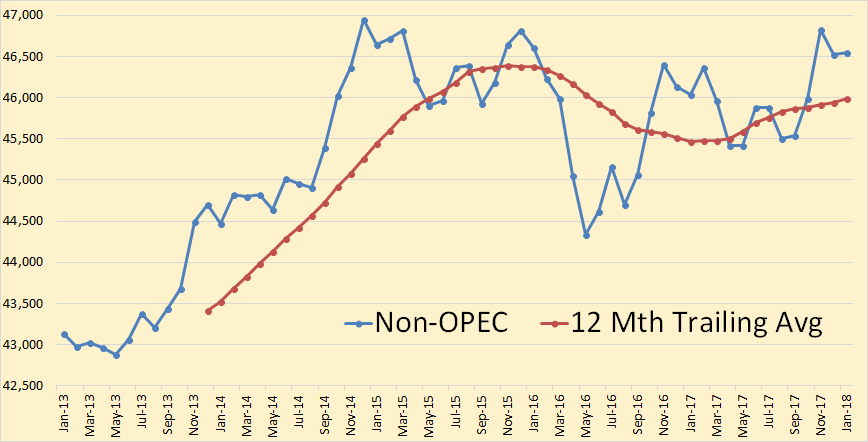
Non-OPEC C+C production was up 20,000 bpd in January but down 275,000 barrels per day from November.
(Click to enlarge)
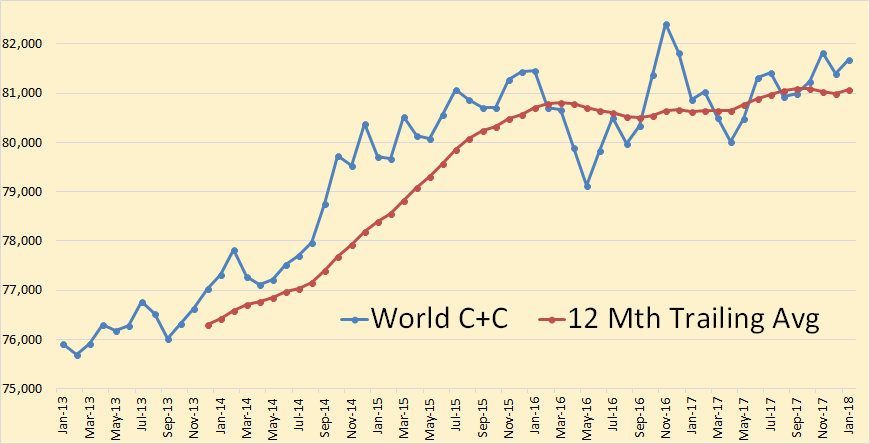
World C+C production was up 136,000 bpd in January but still down 730,000 barrels per day from the latest all-time high of 82,411,000 barrels per day in November of 2016.
By Peak Oil Barrel
More Top Reads From Oilprice.com:
- Higher Oil Prices Look Likely
- U.S. Renewable Capacity Soars
- ConocoPhillips Moves To Seize Venezuelan Oil Assets


