Looking back over a period as long as a year may, to many traders, seem like a pointless exercise. One of the psychological traits needed if you are to trade regularly and stay sane is a poor, or at least selective, memory. Wrong calls and mistakes are inevitable. Dwelling on them only produces fear and trepidation, neither of which are conducive to making good decisions. However, I frequently stress the importance of setting and sticking to stop losses and if you have done that, looking back can be informative. It shows the importance of being disciplined in that regard and enables you to learn from both successes and failures. With that in mind, let’s look back at the last twelve months.
2018 has been a funny old year, but then in retrospect they all are, as markets, particularly commodity markets like oil futures, rarely move in one direction for long. When you look back, therefore, what stands out are the abrupt reversals such as we have seen since the beginning of October in crude. It is worth remembering though that that move was preceded by a long upward grind that started at levels very close to where oil is currently trading, as is clear on the 2-Year daily chart for the crude futures contract, CL below.
Of course, that doesn’t make it certain that…
Looking back over a period as long as a year may, to many traders, seem like a pointless exercise. One of the psychological traits needed if you are to trade regularly and stay sane is a poor, or at least selective, memory. Wrong calls and mistakes are inevitable. Dwelling on them only produces fear and trepidation, neither of which are conducive to making good decisions. However, I frequently stress the importance of setting and sticking to stop losses and if you have done that, looking back can be informative. It shows the importance of being disciplined in that regard and enables you to learn from both successes and failures. With that in mind, let’s look back at the last twelve months.
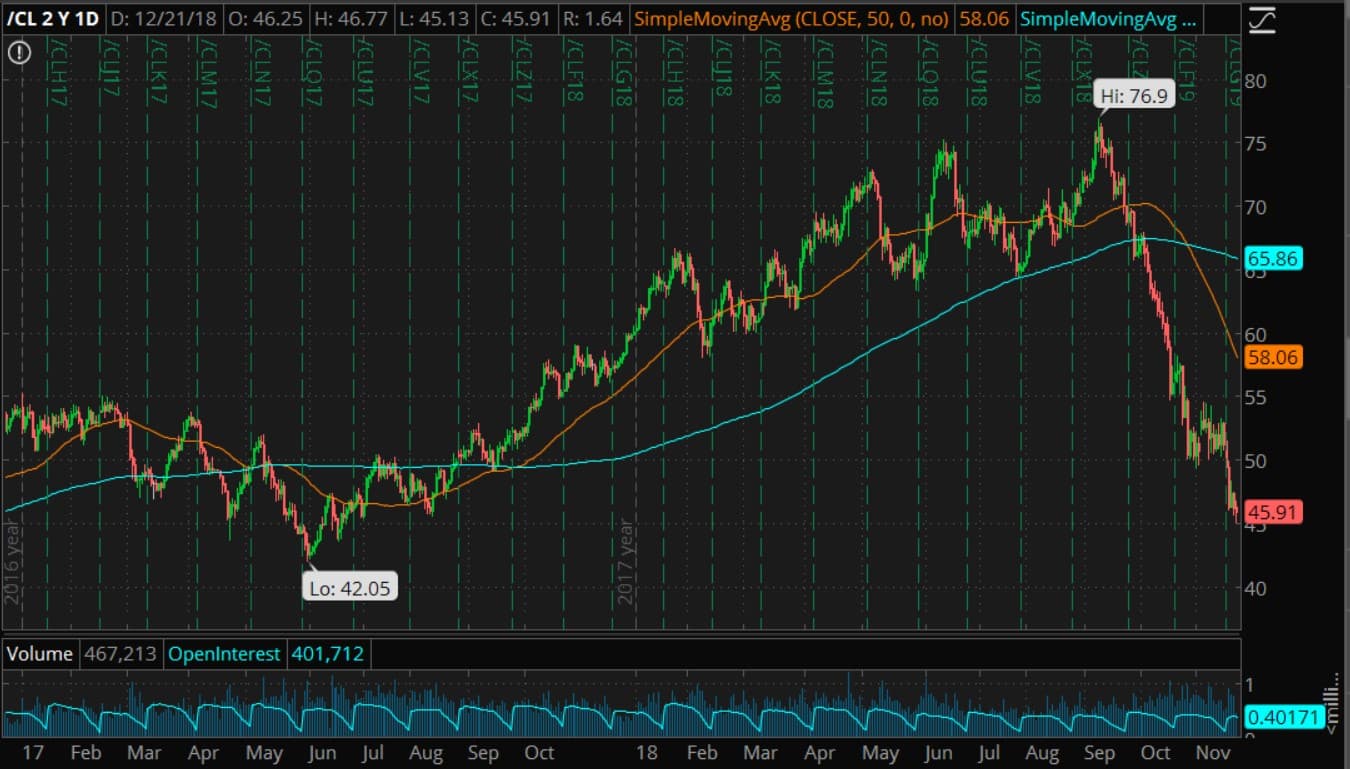
2018 has been a funny old year, but then in retrospect they all are, as markets, particularly commodity markets like oil futures, rarely move in one direction for long. When you look back, therefore, what stands out are the abrupt reversals such as we have seen since the beginning of October in crude. It is worth remembering though that that move was preceded by a long upward grind that started at levels very close to where oil is currently trading, as is clear on the 2-Year daily chart for the crude futures contract, CL below.

(Click to enlarge)
Of course, that doesn’t make it certain that 2019 will see a similar reversal, but it does make it more likely, and looking at it this way is a useful antidote to the sense of never-ending doom that is prevalent now. In fact, if you look at what caused both that long move up and the collapse, the panic that is driving oil ever lower right now looks misplaced.
On the supply side of the equation, what drove oil higher was the impact of the output cuts established by the agreement between OPEC and other big producers, signed in December 2016 and extended in March of 2017. As you can see, it took time for those cuts to impact the price of oil, but once it began to, the march upward was pretty relentless.
The other supply factor, the one that is being frequently cited as the reason WTI has collapsed is the big increase in U.S. shale production. We have, though, on several occasions over the last few years, clearly seen that that output is very price sensitive. Why should this time be any different?
There were obviously demand considerations that helped the move up in the early part of the year too. Most of 2018 has played out in an atmosphere of optimism about global growth, and therefore oil demand. That changed recently however, and a combination of fears about Brexit and the effects of protectionist policies in the U.S. has been at least part of the reason for the collapse in oil, and U.S. stocks as well for that matter. But, when you look back, those things are nothing new. The Brexit vote was back in June of 2016, and Trump announced the first round of tariffs in March of this year, and neither of those things prevented WTI from soaring to multi-year highs in the $70s.
Let’s make it clear, I’m not saying here that oil prices are going to turn around tomorrow and move in a straight line back up to $70. That is possible, but not likely given that there is as yet no progress on a trade deal between the U.S. and China, Brexit is even more of a mess now than ever, and that U.S. output has not really begun to adjust to lower prices. The latest EIA data shows a small drop in output for the first time in a while, but it is only one report and the decline is too small to be significant.
What 2018 has taught us though is that even with the demand issues unresolved, oil can climb higher. With the combined influence of the renewed OPEC plus agreement and the lower price of oil that looks likely to happen. There are risks of course. A political crisis in the U.S. that derails everything and further declines in Chinese growth spring to mind, and there are a whole host of others as well but, on balance, the lesson from 2018 is that oil should move higher during 2019.