


Genscape’s Weekly Gasoline Demand Report data shows relatively flat growth in weekly year-on-year demand for September through November. On the other hand, the U.S. Energy Information Administration (EIA) Weekly Products Supplied data has shown year-on-year declines over the same period despite lower gasoline prices.
Our data shows U.S. total motor gasoline spot prices averaged $1.56/gal on November 28, down almost $0.70/gal from the high of $2.25/gal on October 2, pushing prices to the lowest level since June 30, 2017. Gasoline demand generally increases during prolonged periods of low prices, casting doubt on the demand declines.
What’s Going On?
Genscape analyzed this discrepancy and found the root cause lies in the methodology differences between our data and the EIA. While our data is based on actual gasoline liftings from rack locations headed to gas stations/consumption points, EIA Product Supplied data, both weekly and monthly, is a calculation of implied demand for refined products. The EIA uses a combination of survey components, production, inputs, stock change, ethanol adjustment, imports, and exports in a formula to estimate demand.
This disparity between the two numbers appears to be related to the recent decrease in gasoline imports and increase in gasoline export levels, two factors that the EIA includes in its formula to calculate Products Supplied. By adding imports and subtracting exports, this shift change in recent import/export patterns has had a depressive effect on the Weekly EIA Products Supplied level, showing declining year-on-year demand during a time of sharply falling prices at the pump. The basis for the Genscape Weekly Gasoline Demand Report is total U.S. rack liftings, sourced from our Supply Side data. These rack liftings represent the movements of gasoline from secondary (rack) terminals to retail stations. Our team calculates the total weekly U.S. rack activity and then adjusts the number for missing coverage using the coverage percentages between Supply Side total U.S. monthly average bpd and EIA Products Supplied monthly. Related: Is This The Most Crucial Factor For Oil In 2019?
In general, there is typically more volatility in the EIA Weekly Gasoline Products Supplied level from week to week, while the Genscape’s Weekly Gasoline Demand Report number shows a smoother trend. This volatility is likely due to the formulaic calculation of Products Supplied and the week-to-week differences that can result in the formula components from the survey process. When looking at four-week rolling averages of our Weekly Gasoline Demand Report and EIA Weekly Products Supplied, this volatility in the EIA data is reduced, and correlations (r) between the two data sets were 0.96 in 2017 and 0.96 in January through August in 2018. Since September, this correlation coefficient between the four-week rolling averages has declined to 0.43.
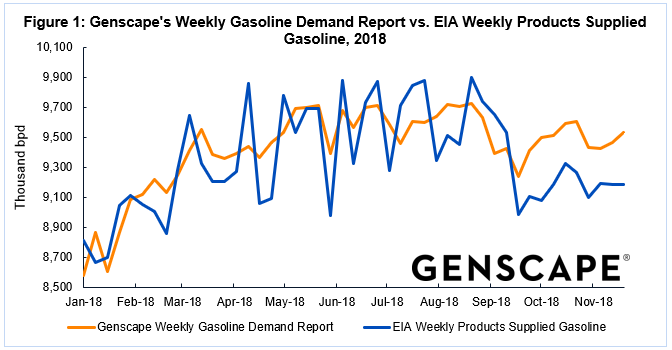
Figure 1: Genscape Weekly Gasoline Demand Report vs. EIA Weekly Products Supplied Gasoline, 2018. Click to enlarge
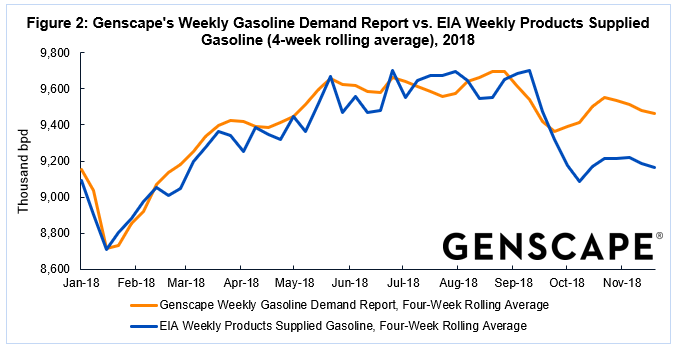
Figure 2: Genscape Weekly Gasoline Demand Report vs. EIA Weekly Products Supplied Gasoline (4-weeks rolling average), 2018. Click to enlarge
This possible underestimation of U.S. gasoline demand within the EIA Products Supplied Weekly data is also running counter to the year-on-year trends seen in our Supply Side Prime Normalized data.
Supply Side Prime Normalized data is an estimation of domestic U.S. gasoline demand, calculated using a linear regression model to EIA Prime Suppliers Monthly and daily Supply Side data by PADD. This year-on-year trend, calculated using the Prime Normalized data for 2018 and 2017, appears to more closely follow the trend seen in our Weekly Gasoline Demand Report data – showing relatively flat to slightly higher demand year-on-year for September through November. The EIA Weekly Products Supplied data, on the other hand, has shown a general trend of year-on-year declines for the same weeks.
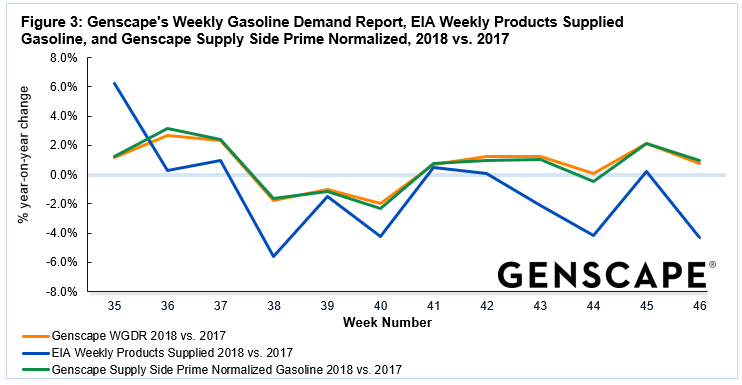
Figure 3: Genscape Weekly Gasoline Demand Report, EIA Weekly Products Supplied Gasoline, and Genscape Supply Side Prime Normalized, 2018 vs. 2017. Click to enlarge
Analysis of EIA Product Supplied: Falling Imports, Rising Exports
Weekly EIA gasoline imports fell to the lowest levels since January in November, averaging 253,000 bpd and 247,000 bpd for week ending November 9 and November 16, respectively. On a four-week average basis, weekly U.S. gasoline imports for week ending November 23 fell to 363,000 bpd, the lowest level seen seasonally (fourth quarter) since 1997. At the same time, weekly U.S. gasoline exports have surpassed year-ago levels since September, with the rolling four-week average rising to a record high of 1.04mn bpd on week ending October 26, according to EIA data. This trend in ample U.S. gasoline exports fell somewhat in November but occurred at the same time as the decline in imports, resulting in exports exceeding imports between 487,000 bpd and 697,000 bpd for week ending November 9 (week 45) to week ending November 23 (week 47). For week ending October 12 (week 41), the disparity between exports and imports widened to a record 707,000 bpd, according to EIA data.
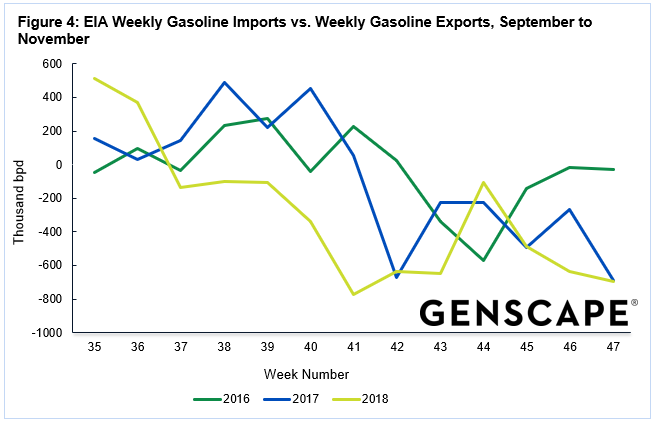
Figure 4: EIA Weekly Gasoline Imports vs. Weekly Gasoline Exports, September to November. Click to enlarge
Our team compared the difference between its our Weekly Gasoline Demand Report data and EIA Weekly Products Supplied for Gasoline, and the difference between EIA Weekly Gasoline Import and Export volumes for week ending August 31 to week ending November 23. An analysis for correlation showed that there is a strong inverse correlation coefficient (-0.74) between the difference in the Genscape/EIA weekly demand data and the difference between EIA weekly gasoline imports and exports. As this import/export difference declines on a weekly basis, the residual between Genscape’s weekly U.S gasoline demand calculation and the EIA Weekly Products Supplied number increases. Related: Could Iraq Be The Next OPEC Member To Exit?
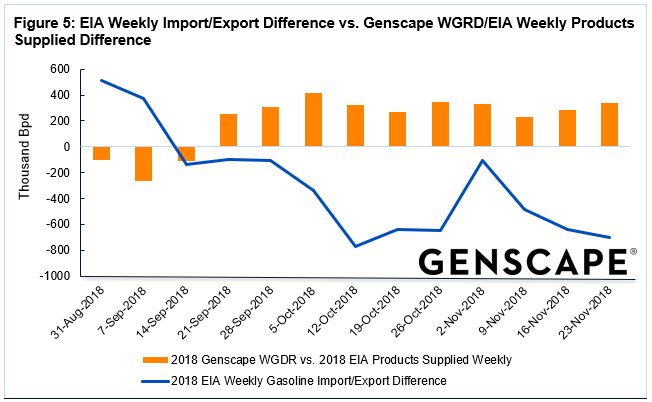
Figure 5: EIA Weekly Import/Export Difference vs. Genscape WGDR/EIA Weekly Products Supplied Difference. Click to enlarge
Conclusion
Our Supply Side data shows that year-on-year U.S. gasoline demand was generally stronger between September and November and the record-setting differences between EIA weekly gasoline imports and exports appear to be skewing the EIA Product Supplied Weekly Gasoline data lower. Gasoline imports and exports are part of the formula used to calculate EIA’s estimate of implied demand. Our Weekly Gasoline Demand Report and Prime Normalized data both show year-on-year increases supported by lower gasoline prices.
Our Supply Side Monitor and Analyst data provides insight into PADD- and rack-city refined product volumes and average prices into PADD from actual transactions at the rack level, where gasoline and diesel are distributed from secondary storage terminals to retail stations.
In addition, our Weekly Gasoline Demand Report provides total U.S. gasoline consumption on a weekly basis on Mondays at 10:30 am ET, two days before the EIA. The analysis uses our Supply Side Monitor hourly data, sourced from actual rack liftings of gasoline (e.g. truck movements of finished gasoline from racks to retail stations).
By Genscape
More Top Reads From Oilprice.com:
- U.S. Becomes Net Oil Exporter For First Time In 75 Years
- Oil Soars After OPEC And Partners Reach Deal
- Is This The Next Big Petrochemical Hub In The U.S.?


