U.S. West Texas Intermediate crude oil futures posted a volatile two-sided trade this week before turning decisively lower for the week. Volume was light at the start of the week due to a U.S. bank holiday, but that didn’t stop prices from edging lower on Monday.
Rising Supply Worries
The early trade was influenced by concerns over rising supply from OPEC and the United States. However, losses were limited by worries over falling Iranian output as we inched closer to the start of U.S. sanctions in November.
According to a week-end report, output from OPEC rose by 220,000 barrels per day (bpd) between July and August, to a 2018-high of 32.79 million bpd. The rise in output was fueled by a recovery in Libyan production and strong Iraqi exports.
Additionally, traders were saying that rising U.S. production could become an issue after Baker Hughes reported on August 31 that U.S. drillers added oil rigs for the first time in three weeks. The rig count increased by 2 units to 862. Furthermore, in August, the U.S. Energy Information Administration reported that U.S. crude oil production hit a record 11 million bpd.
Hedge Funds Increase Bullish Bets
Other supportive news was government data released on August 31 that said hedge funds are betting that the markets will be supported by the notion that U.S. sanctions on Iranian crude oil exports will eventually lead to constricted markets.
Hurricane Spike
Prices spiked higher on Tuesday…
U.S. West Texas Intermediate crude oil futures posted a volatile two-sided trade this week before turning decisively lower for the week. Volume was light at the start of the week due to a U.S. bank holiday, but that didn’t stop prices from edging lower on Monday.
Rising Supply Worries
The early trade was influenced by concerns over rising supply from OPEC and the United States. However, losses were limited by worries over falling Iranian output as we inched closer to the start of U.S. sanctions in November.
According to a week-end report, output from OPEC rose by 220,000 barrels per day (bpd) between July and August, to a 2018-high of 32.79 million bpd. The rise in output was fueled by a recovery in Libyan production and strong Iraqi exports.
Additionally, traders were saying that rising U.S. production could become an issue after Baker Hughes reported on August 31 that U.S. drillers added oil rigs for the first time in three weeks. The rig count increased by 2 units to 862. Furthermore, in August, the U.S. Energy Information Administration reported that U.S. crude oil production hit a record 11 million bpd.
Hedge Funds Increase Bullish Bets
Other supportive news was government data released on August 31 that said hedge funds are betting that the markets will be supported by the notion that U.S. sanctions on Iranian crude oil exports will eventually lead to constricted markets.
Hurricane Spike
Prices spiked higher on Tuesday with the near-term October futures contract taking out its summer top after a developing hurricane in the Gulf of Mexico caused the evacuation of two Gulf of Mexico oil platforms, disrupting supply operations.
Sellers Return
Sellers retook control on Wednesday, driving speculative buyers out of the market after Hurricane Gordon missed the key crude oil platforms in the Gulf, ending worries over a potential supply disruption. This shifted the focus back to the traditional supply/demand fundamentals.
The weakness after the hurricane price spike suggested investors had shifted their focus away from supply concerns, which drove up prices last week, to demand concerns. One issue bothering bullish traders is the risk of declining Chinese demand for oil. According to CNBC, Middle East officials are worrying more about China at this time than Iran’s supply curbs as a result of U.S. sanctions.
China Demand is a Worry
Bahrain and Oman’s oil and gas ministers both told CNBC Monday that China’s demand for oil could decline on the back of its trade dispute with the U.S. that has seen tariffs imposed on a wide range of Chinese imports.
“I think there is a risk on the demand side,” Bahrain’s Oil Minister Sheikh Mohammed bin Khalifa told CNBC’s Hadley Gamble in Muscat, Oman. “Is demand going to continue as strongly as it did?”
“Obviously the trade issue is going to impact demand in a negative fashion if it continues and persists. You’ve got the strong dollar, which is another factor.”
Oman’s Mohammed bin Hamad Al Rumhy said, “There is a danger that the demand will be impacted as well. People often focus on the supply side – what happens if Iran stops supplying – but what happens if China reduces its consumption? So we are looking at both sides of this discussion.”
“I see that as a possibility as well. If there is a serious trade disagreement between the U.S. and China, the Chinese consumption of energy will be impacted negatively, from our point of view and the ability to produce and export will be impacted,” he said at the World Heavy Oil Congress.
“And I think, and many people agree with me, that the demand will be impacted – so that’s not good for us.”
The bearish tone spilled over to Thursday with the release of the U.S. Energy Information Administration’s weekly inventories report.
Weekly EIA Inventories Report
On Thursday, the markets were driven lower by a two-sided government inventories report. The U.S. Energy Information Administration (EIA) reported that U.S. commercial crude oil inventories fell by 4.3 million barrels to 401.49 million barrels in the week to August 31, the lowest since February 2015. This was the bullish news.
The bearish news, which drove prices sharply lower, was a 1.8 million barrel rise in gasoline stocks. Distillate stockpiles also contributed to the losses with a 3.1 million barrel increase during the week-ending August 31.
The EIA also said U.S. crude oil production last week remained at a record 11 million barrels per day (bpd), a level it has largely been at since July.
Monthly Technical Analysis

(Click to enlarge)
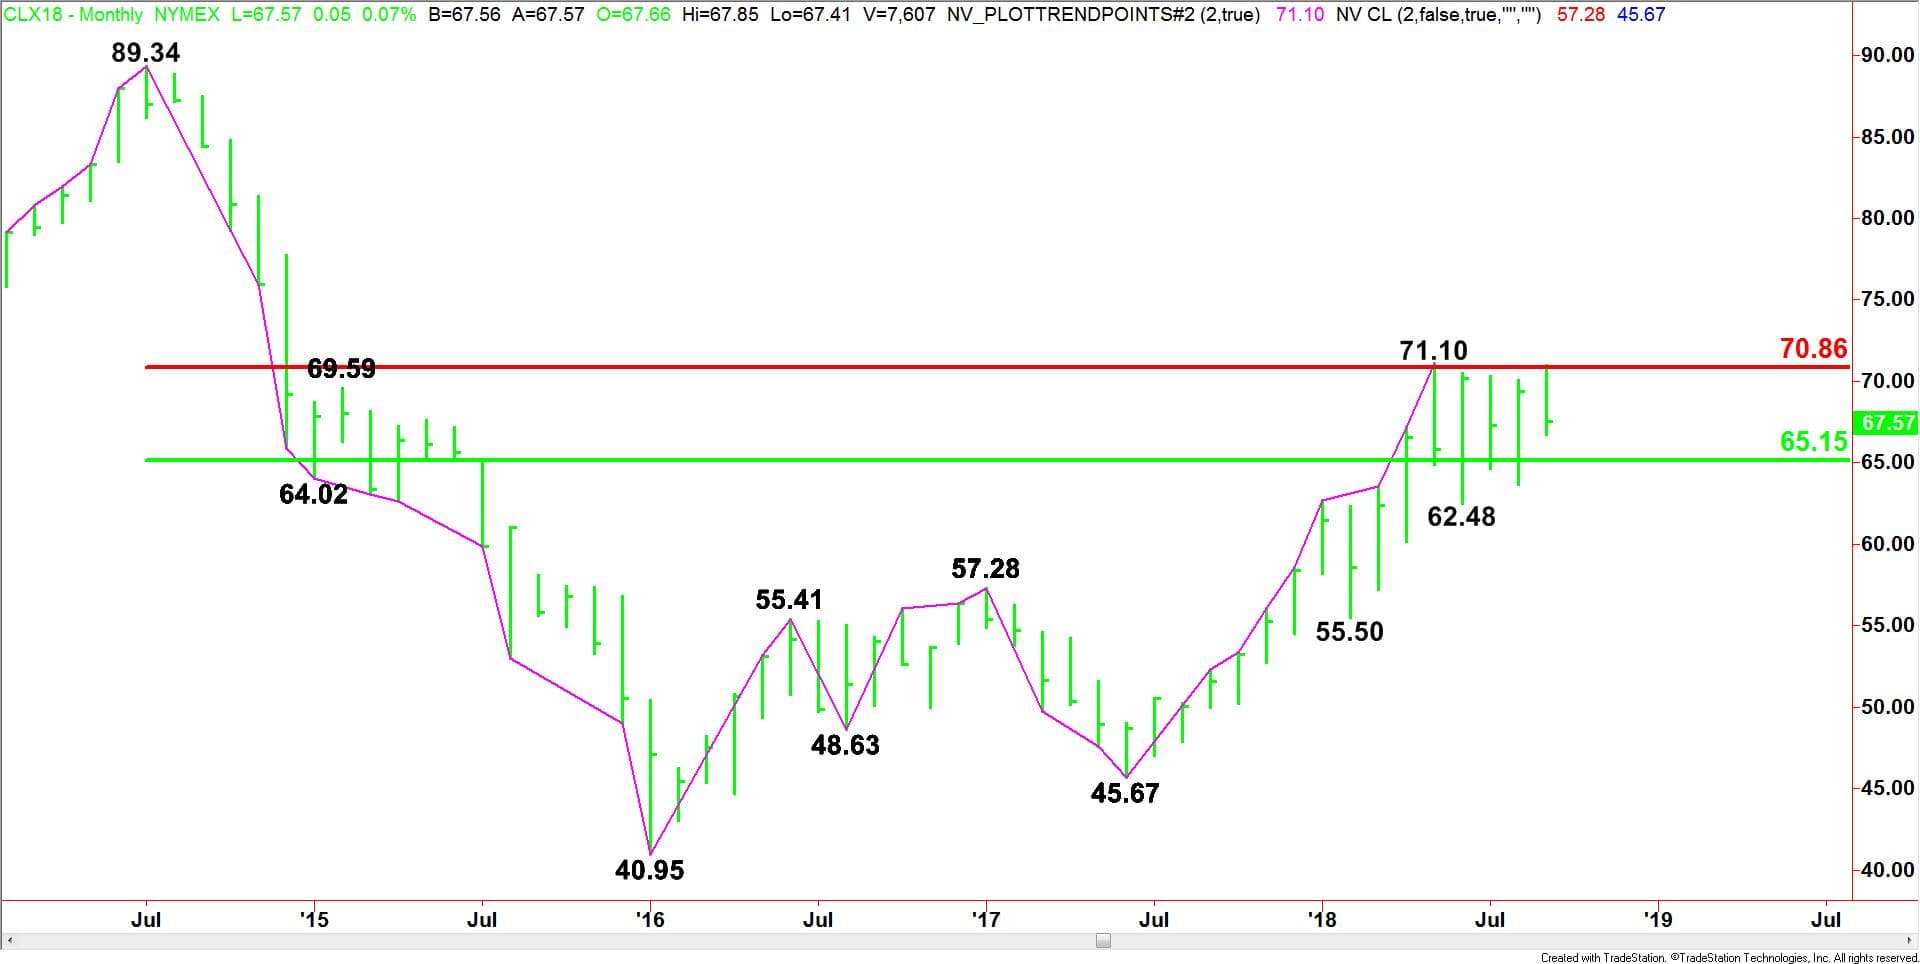
The main trend is up according to the monthly trend indicator chart. A trade through $71.10 will signal a resumption of the uptrend after more than three months of consolidation. The market is in no position to change the main trend to down, but we could see a reversal top, which would signal a shift in momentum, or a change in the minor trend, which would indicate the selling is greater than the buying at current price levels.
The minor trend is also up a trade through $62.48 will change the minor trend to down.
The contract range is $89.34 to $40.95. Its 50% to 61.8% retracement zone at $65.15 to $70.86 is controlling the near-term direction of the market. It has been holding the market in a range since June.
Based on the recent price action on the monthly chart, the direction of the November WTI crude oil market in September is likely to be determined by trader reaction to the May high at $71.10.
A sustained move under $71.10 will indicate that sellers are defending the upside. If this creates enough downside momentum then we could see a break into the 50% level at $65.15.
Breaking through $65.15 will indicate the selling is getting stronger. This could trigger a further break into the minor bottom at $62.48.
The minor trend will change to down on a trade through $62.48. This will also shift momentum to the downside. This price is also the trigger point for a potential acceleration to the downside with the next target the minor bottom at $55.50.
A sustained move over $71.10 will signal the presence of buyers. This is a potential trigger point for an acceleration to the upside. The monthly chart indicates there is plenty of room to the upside if this price is taken out with strong volume. The first target is $77.75.
Forecast
The price action this week suggests that traders are still trying to find a balance point on the charts to satisfy both bullish and bearish traders. Since mid-August, crude oil has been driven higher by worries about a supply shortage and a weakening U.S. Dollar. This week, prices have been driven lower by too much supply and worries over global demand.
The monthly chart shows that prices have been locked in a range for a little more than 3 months. The range is basically 50% to 61.8% of the contract range. This is by definition a balance area.
(Click to enlarge)
Furthermore, on the daily chart, the August to September range is $63.39 to $70.98. Its 50% to 61.8% retracement zone is $67.34 to $66.47. Thursday’s selling stopped inside this zone.
I expect the headlines to continue to produce both bullish and bearish results so prices are likely to continue to be rangebound until the start of the Iran sanctions on November 1.
The wild card the next few weeks could be supply disruptions due to potential hurricane activity in the Gulf of Mexico. As of early Friday, traders are tracking as many as three tropical storms in the mid-Atlantic. It’s a little too early to tell if or when they will make landfall, but it is something to start watching.