


For 4 years now the oil price (Brent) has been range bound between $90 and $130 per barrel (Figure 2). This is where it settled after the convulsions of the $148 per barrel peak in 2008 followed by the financial crash. Recently it has dipped to around the $80 mark and although we have seen a slight recovery many analysts believe it could break lower.
With the world in turmoil, including OPEC producers Iraq and Libya ± Iran, and Russia cast out by the West, one might expect the oil price to be quite perky. But the opposite is true. This post takes a look at some of the key production indicators from OPEC, Europe, N America and Russia. But I believe one needs to look no further than Figure 1 to understand the weakness in the oil price. Rampant production in the USA, the world’s largest oil producer and importer, means that competition for supplies on the international markets is weakening. The world is once again drowning in oil.

Figure 1 USA oil production has grown an astonishing 4 million barrels per day in 4 years thanks largely to shale oil development supported by high oil price.
So does that mean the real energy crisis is over? Well not quite. One needs to understand that shale oil, the US miracle, is expensive to produce. Over production of an expensive resource that dumps the price below the profit level is one of the effects of broken capitalism on the back side of Hubbert’s peak.
Related: 2014 May Be A Crucial Year For Iranian Oil
Data
All data reported here are taken from the monthly International Energy Agency (IEA) oil market reports. OPEC data are for crude oil only and specifically exclude condensate and natural gas liquids (NGL). Production figures for other countries are for crude oil, condensate, NGL and non-conventional sources. The IEA data are used in preference to other sources because they are now the only source to report on OPEC spare capacity which is on occasions a key indicator. All data are to August 2014, the July and August figures subject to minor future revisions.
The latest chapter of the oil story begins with the plunging oil price (Figure 2). Range bound for 4 years, it is now threatening to break out to the low side. What fundamental aspect of supply and demand has changed to cause this chronic weakness in price?

Figure 2 Brent oil price from The Financial Times 13 October 2014.
Oil production and consumption are always roughly in balance since global oil storage is small in relation to the massive daily flows. Global production is rising steadily, and has been doing so since the illusory 2008 peak caused by the financial crash (Figure 3). There is absolutely nothing in the global total supply figures to warn of impending weakness in price.

Figure 3 Global oil production continues to grow reaching a recent peak of 93.4 million barrels per day in June 2014 confounding any notion of a pending peak in global production.
OPEC
For a number of decades, OPEC and in particular Saudi Arabia, have been astute at matching global supply to demand in order to deliver the price that OPEC (i.e. Saudi Arabia) wants. Figure 4 shows the stack of OPEC production + spare production capacity. Total OPEC capacity has been on a plateau of 35 million barrels per day since 2009 and if anything is now drifting slowly down. The only remarkable thing about OPEC production has been its stability in recent years when confronted with chaos in major producers Iraq and Libya. Notably, there has been no move to reduce production to support price in the face of an additional 4 million barrels per day production in the USA.

Figure 4 The black band of Ecuador marks the top of actual OPEC production, the grey band at top denotes spare production capacity (see Figure 5)

Figure 5 The oil price spike of 2008 was marked by OPEC spare capacity being squeezed close to zero, i.e. everyone was pumping flat out to meet rampant demand. The financial crash put an end to that party and saw OPEC rein in production by about 5 million bpd to compensate for the temporary destruction of demand. While most OPEC countries book some spare capacity in most cases this is small and it is widely held that the only country with meaningful capacity to spare is Saudi Arabia.

Figure 6 There is no sign of Saudi Arabia cutting production to make way for new US production in the global market. Saudi production has been stable at about 10 million barrels per day for about 4 years with spare capacity running at around 2. 5 million barrels per day. NZ = neutral zone between Saudi Arabia and Kuwait where the two countries share production equally from the Wafra oil field.

Figure 7 Iraqi production remains on a growth trend with no real sign of recent turmoil having any significant impact. Most of Iraq’s production comes from the south of the country, a long way away from the IS incursions to the north. But there are large fields in the centre and north of the country such as Kirkuk and East Baghdad.

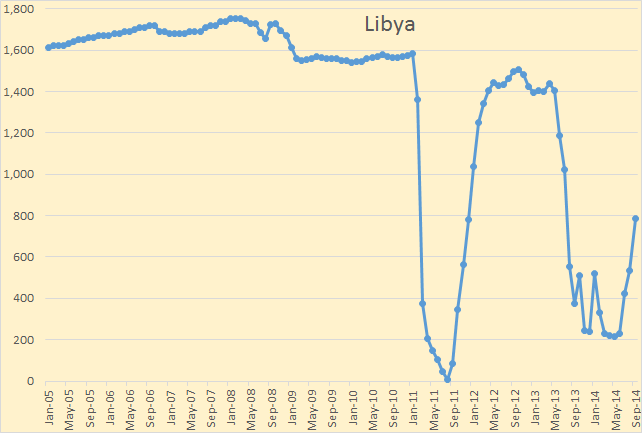
Figure 8 According to the IEA data, Libyan production remains largely off line although this chart over on PeakOilBarrel which is OPEC data up to September 2014 suggests Libyan production may be recovering. This might add further weakness to the oil price.

Figure 9 I’m not sure what is going on with Iranian production. Iran has been subject to western sanctions and this initially impacted their exports. Sanctions may also impact Iran’s ability to maintain production equipment etc.

Figure 10 Angola is an OPEC country facing natural production declines. As all production off shore is deep water, Angolan production may go the same way as the North Sea.
North America

Figure 11 Canada and Mexico are not changing much in recent years, a small rise in Canada cancelling slow decline in Mexico. The North American story is dominated by production growth in the USA (Figure 1).
Europe

Figure 12 After a decade of decline and recent records in investment, North Sea production appears to have stabilised at above 3 million barrels per day. This stabilisation will also have a negative impact upon the oil price since North Sea decline was, in part, absorbed by the growth in North American production.
Related: World’s Most Expensive Oil Project Just Got More Costly
Russia and FSU

Figure 13 No grand tour of global production would be complete without a look at the Former Soviet Union where production is little changed over the last 4 years. The other FSU production is dominated by Azerbaijan and Kazakhstan.
Discussion
The explanation of weakening oil price appears quite straightforward. Production of expensive shale oil in the USA has boosted production by 4 million barrels per day in 4 years. Natural declines in other areas like the North Sea have been arrested and will be reversed in the years ahead as a number of large new projects come on stream. OPEC has made no move to reduce production to make way for additional US oil and the price has given way to the economic reality of supply exceeding demand driving prices down.
Other factors to consider are the on-going economic concerns in the OECD, parts of which are set to slide back into recession as the debt burden continues to weigh and slowing growth in East Asia. Lower oil prices will of course help on those fronts.
Political and social turmoil stretching from Ukraine through Iraq and N Africa to northern Nigeria is having remarkably small impact upon oil supplies, apart from Libya. But Libya too is perhaps emerging from the abyss and new oil from Iraqi Kurdistan that is likely by-passing the international metering system, will be adding to the over-supply woes.
Why has OPEC not cut production? This would certainly boost oil prices and countries like Saudi Arabia reportedly require an oil price over $100 / barrel to remain solvent. It is also reported that US shale oil requires a price over $90 / barrel to turn a profit. And so, if Saudi were to close some valves this would help sustain the US shale boom and result in expanding the current over supply situation.
The oil markets are in for a period of instability while Saudi Aramco tries to stare down the US shale operators. Who will blink first?
by Euan Mearns
(Source: http://euanmearns.com)
More Top Reads From Oilprice.com:
- How Cool Heads Can Prevail In This Panic
- Buy This Stock To Take Advantage Of Both Oil And Equity Weakness
- 5 Reasons Oil Prices Are Dropping


Well deserved - considering Putin's aggression and such.