


Despite the wide variation of predictions from 2015 through to 2017—ranging from stable oil prices falling into the $30s to a rebound up to the $70s by the fourth quarter of 2017—West Texas Intermediate (WTI) yearly average oil prices have remained fairly consistent.
WTI has largely traded in the $40s, allowing slim profits to be made in certain regions of the country. The yearly average for 2015 was $48.90. In 2016 it was $43.38. And 2017 saw $49.35. Combined, that’s a three-year average of $47.21 per barrel.
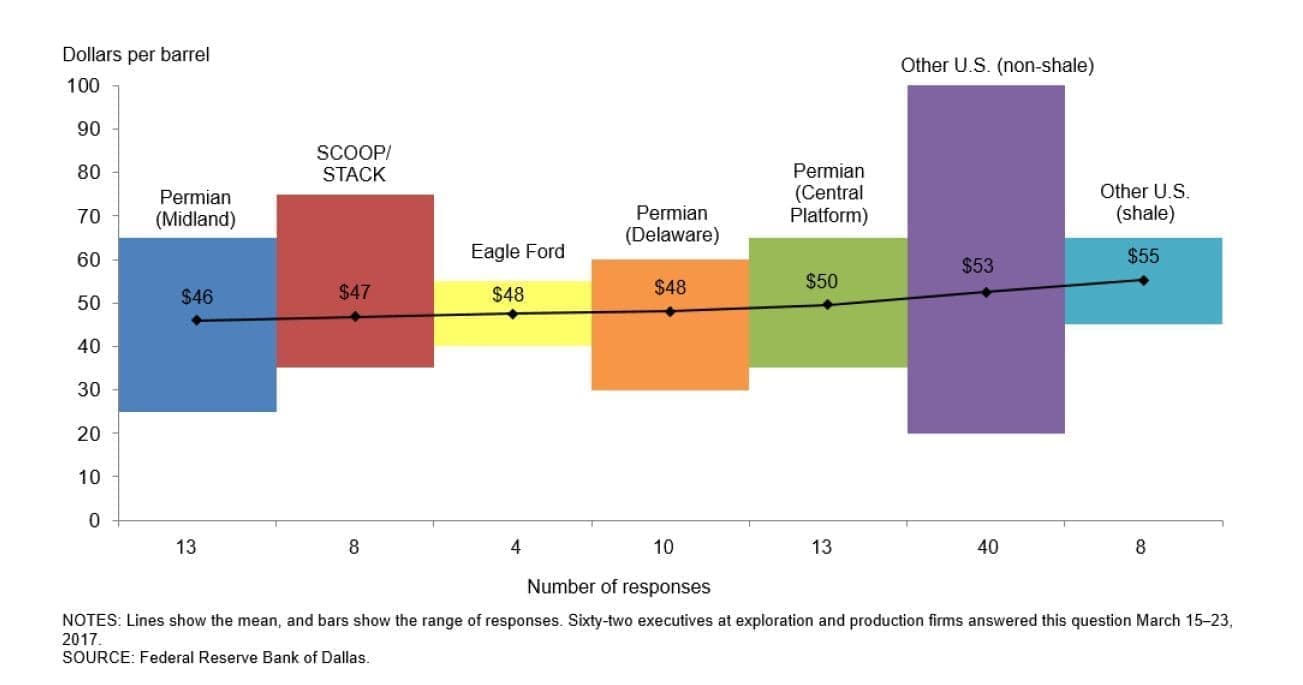
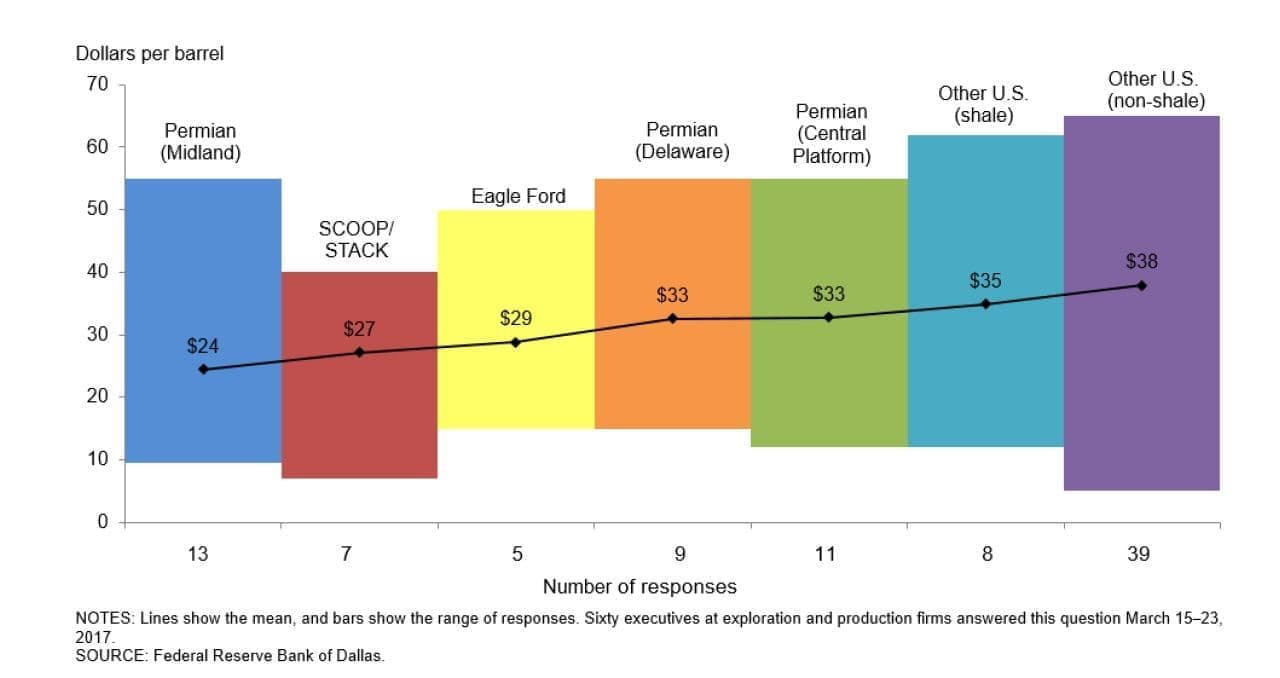
According to a report by the Federal Reserve Bank of Dallas in March 2017, E&P firms claimed that their breakeven price points in the Permian Basin came in at around $46 per barrel (see chart). However, companies like Shell stated that they could make money at $40 oil and at $20 for new wells. In this same report, breakeven price points for the Permian Basin were at $24 from 2000 to 2007, while the WTI yearly average oil price for that time period was $38.89 per barrel.
(Click to enlarge)
(Click to enlarge)
During the oil price bubble between 2007 and 2014, the yearly average WTI oil price was $78.33 per barrel. An interesting note is that from 1975 (the birth of the Petrodollar) through 2017, WTI yearly average oil prices have been over $60 only eight times, or 16 percent of the time. During this same time period, WTI yearly average oil prices have been over $40 only 13 times or 27 percent of the time, and the yearly average of WTI during this same time period has been over $30 only 17 times, or 35 percent of the time. Related: Cold Weather Shocks Natural Gas Prices
So if you take the WTI yearly average price from 1975 through 2017, it’s $35.65.
Also, since 1975, yearly average oil prices have been below this yearly average mean price 68 percent of the time.
In the years from 1980 through 2004, the yearly average WTI oil price was consistently around $18 to $20 per barrel despite some years where it averaged in the low teens.
This type of insight is helpful when analyzing future net cash flows on engineering evaluations, prior to investing. Some such reports have recently showed starting prices of $50, rising to $65 over the next 15 years. But as you’ve seen here, history doesn’t lend itself to those type of unrealistic predictions. Future estimates are just that: estimates based on someone’s prediction, with both good and bad future predictions.
If I bought stock today in an E&P company, I’d want to know their breakeven price points for each field and what those projections were for the near future—at least 5 to 10 years, if possible.
With today’s lower development and drilling costs, there’s no reason that associated project costs can be adjusted such that it would accommodate breakeven price points at or below $20 per barrel.
In all the years since 1980, that I’ve bought and sold oil and gas projects in the Mid-Continent and West Coast regions of the United States, including now, I’ve consistently used a $17 breakeven price point for both drilling projects and production acquisitions, with great success.
In a previous Oilprice article, I suggested that profits are better realized when pricing was in the downturn times rather than waiting for prices to go back up. You have to be careful what you wish for, because waiting too long could take some valuable time, and you could miss out on a true windfall if prices soar again.
An example of a simple-yet-effective formula for projecting safe breakeven price points over a 10- to 15-year period (from the start of the completion of news wells or acquisitions of existing production) is to compare your gross recoverable oil reserves to your acquisition costs or leasehold costs, drilling and completion costs, production taxes, mineral owners’ royalties, overriding royalties and lease operating expense and use a yearly average price of $17.82 per barrel (1/2 of the WTI yearly average for 1975 through 2017 of $35.65).
For example: 200,000 net recoverable barrels of oil should have no more than a total of $3,564,720 as total project or acquisition costs over a 10-year period, which include all acquisition and leasehold costs, drilling and completion costs, production taxes, mineral owners’ royalties, overriding royalties and lease operating expense (not company overhead).
Related: What’s Behind The Canadian Rig Count Crash
If the project is a new drilling prospect, the actual AFE, including leasehold acquisition (title and leasing) should not exceed $2,376,480 to obtain the same net 200,000 barrels of oil (new vertical or horizontal well with a minimum of a 640-spacing unit per well). This formula would give you a breakeven price point of $17.82 per barrel. In part, this formula may be what allowed Shell to state they could make money at $20 per barrel today in the Permian Basin.
If your circumstances allow you to buy in at $17.82 per barrel, then you should have no problem showing a good return over the life of the project. In another Oilprice article, I mentioned a CEO of a large E&P company that wanted oil prices to go below $30 per barrel due to their breakeven price point being $15 per barrel. Also, this would be the time they would exploit their reserves and elevate their focus on acquiring new projects.
To show the relevance to this low breakeven being a reality, in a recent acquisition of an oil project in Texas, consisting of existing production, good equipment and production facilities, work-overs and re-completes, as well as some drilling on offset development acreage, we were able to use economics to acquire and fully develop based on a $10.82 per barrel breakeven price point over the life of the project.
Happy hunting.
By David Melton
More Top Reads From Oilprice.com:
- Can Norway Survive Without Big Oil?
- Is A “Geopolitical Recession” Looming?
- OPEC vs Shale: The Oil Saga Continues


