


The first of this week's big event risks has finall arrived, and while the world and his pet rabbit is focused on the number's potential for 'dovishness', bear in mind that expectations are for a 0.3% MoM rise and 7.3% YoY rise (which while 'slowing' remains extremely high by any standards). The banks's CPI forecasts were all in sync:
- 7.2% - Barclays
- 7.2% - Credit Suisse
- 7.2% - Goldman Sachs
- 7.2% - Bloomberg Econ
- 7.2% - Citigroup
- 7.2% - Morgan Stanley
- 7.2% - Wells Fargo
- 7.3% - HSBC
- 7.3% - JP Morgan Chase
- 7.3% - UBS
- 7.3% - Bank of America
- 7.4% - SocGen
... which is precisely why the headline CPI printed cooler than all of the major expected, rising just 0.1% MoM, with the YoY rise falling to +7.1%, which was the lowest since Dec 2021...
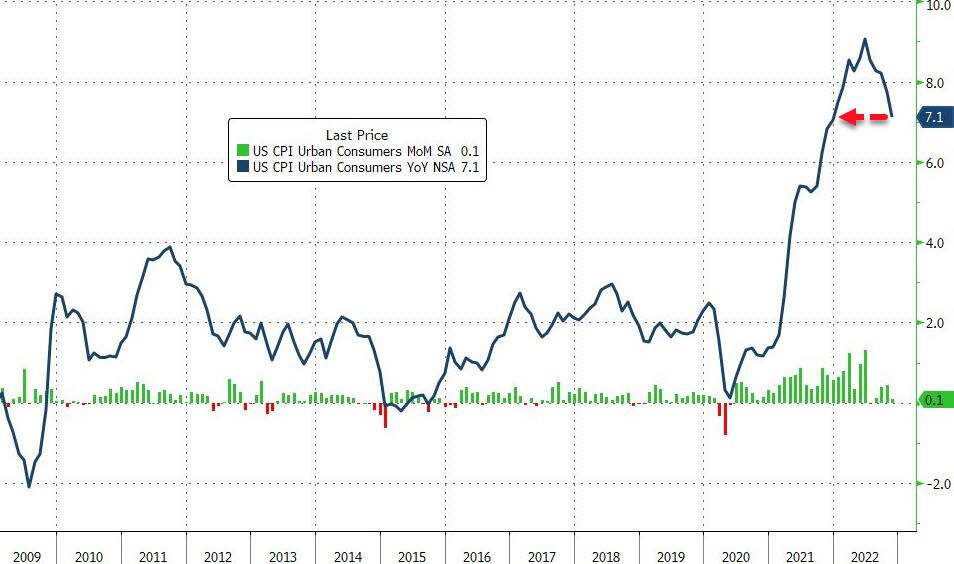
... and the biggest monthly drop (-0.63ppt) in the YOY print (from 7.7% to 7.1%) since 2020...

Core CPI was expected to rise 0.3% MoM also (+6.1% YoY), and like the headline it came in cooler than expected at +0.2% MoM and +6.0% YoY...

Under the hood, energy costs and used cars were the biggest drivers of the cooling...
Services inflation YoY rose modestly as Goods inflation YoY dropped again...

Energy and Goods actually fell in price MoM...

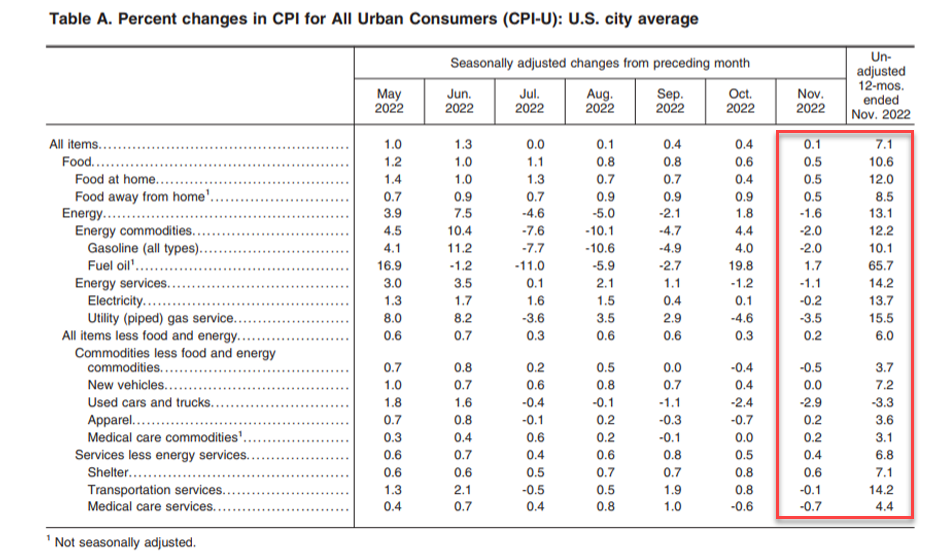
More details from the report, first on food and energy...
- The food index increased 0.5 percent in November following a 0.6-percent increase in October.
- The food at home index also rose 0.5 percent in November. Four of the six major grocery store food group indexes increased over the month.
- The food away from home index rose 0.5 percent in November, after increasing 0.9 percent in each of the previous 3 months. The index for limited service meals increased 0.6 percent over the month and the index for full service meals increased 0.4 percent.
- The energy index fell 1.6 percent in November after rising 1.8 percent in October. The gasoline index declined 2.0 percent over the month, following a 4.0-percent increase in October.
- The index for natural gas continued to decline over the month, falling 3.5 percent after decreasing 4.6 percent in October. The electricity index decreased 0.2 percent in November.
... and then everything else, starting with the shelter index which was the dominant factor in the monthly increase in the index for all items less food and energy:
- The index for all items less food and energy rose 0.2 percent in November, its smallest increase since August 2021.
- The shelter index continued to increase, rising 0.6 percent over the month.
- The rent index rose 0.8 percent over the month, and the owners’ equivalent rent index rose 0.7 percent.
- The index for lodging away from home decreased 0.7 percent in November, after rising 4.9 percent in October.
- The shelter index continued to increase, rising 0.6 percent over the month.
Other components were a mix of increases and declines. Among the indexes that rose in November were:
- The index for communication which increased 1.0 percent over the month after decreasing 0.1 percent in October.
- The index for recreation rose 0.5 percent in November, following a 0.7-percent increase in the previous month.
- The motor vehicle insurance index increased 0.9 percent in November, the personal care index rose 0.7 percent
- The education index rose 0.3 percent over the month.
And on the other side:
- The medical care index fell 0.5 percent in November, as it did in October.
- The index for hospital and related services decreased 0.3 percent over the month, and the index for prescription drugs declined 0.2 percent.
- The index for physicians’ services was unchanged in November.
Other indexes which declined over the month include:
- The index for used cars and trucks fell 2.9 percent in November, the fifth consecutive decline in that index.
- The index for airline fares fell 3.0 percent over the month, following a 1.1-percent decrease in October.
- The index for household furnishings and operations was unchanged in November, as was the index for new vehicles.
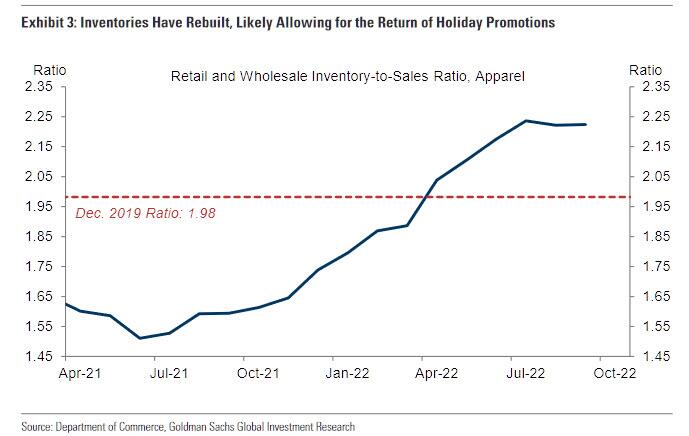
Of the above, it is interesting that apparel prices increased in November. As a reminder, Goldman noted that with the inventory-to-sales ratio for apparel stores is now above its December 2019 level, the more normal availability of apparel items this year is consistent with increased promotional activity, and online price data from Adobe shows a 15.5% decline in apparel prices over the course of November on a not-seasonally-adjusted basis. Expect a sharp drop in apparel prices next month.
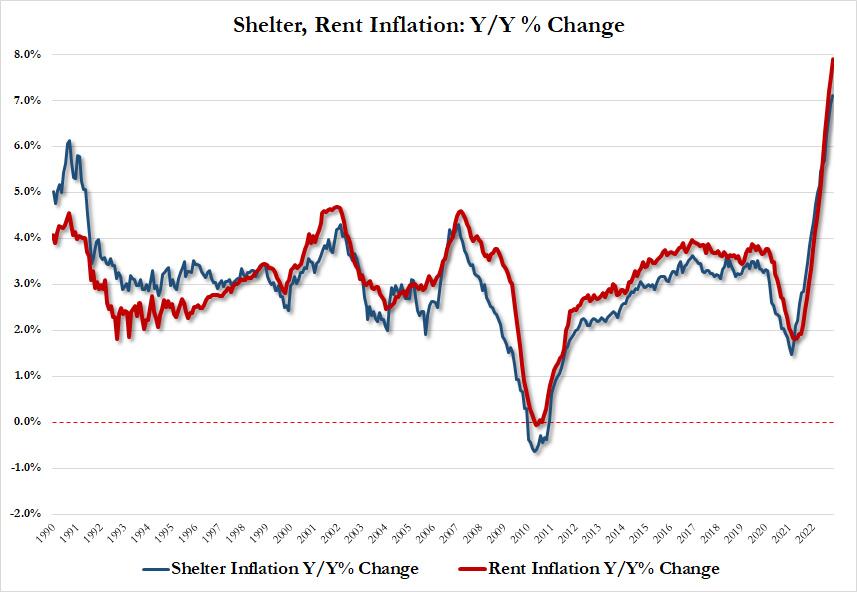
Perhaps most notably, if we exclude shelter - on a sequential basis - we now have deflation, which of course we can't do especially since both shelter and rent inflation are still rising at a rapid pace of 7.12% and 7.91% respectively, but about to roll over hard.
The punchline: if one excludes food (+0.5% M/M) and shelter (+0.7% M/M), it's hard to find any inflation (and in fact, we may well have disinflation):
- Food +0.5% M/M, vs 0.6% prior
- Shelter +0.7%, vs 0.6% prior
but...
- Used Cars -2.9% vs -2.4% prior
- New cars 0.0%, vs +0.4% prior
- Energy -1.6% vs +1.8% prior
- Gasoline -2.0%
- Fuel oil +1.7%, vs +19.8% prior
- Apparel 0.2% vs -0.7% prior
- Medical care 0.2% vs 0.0% prior
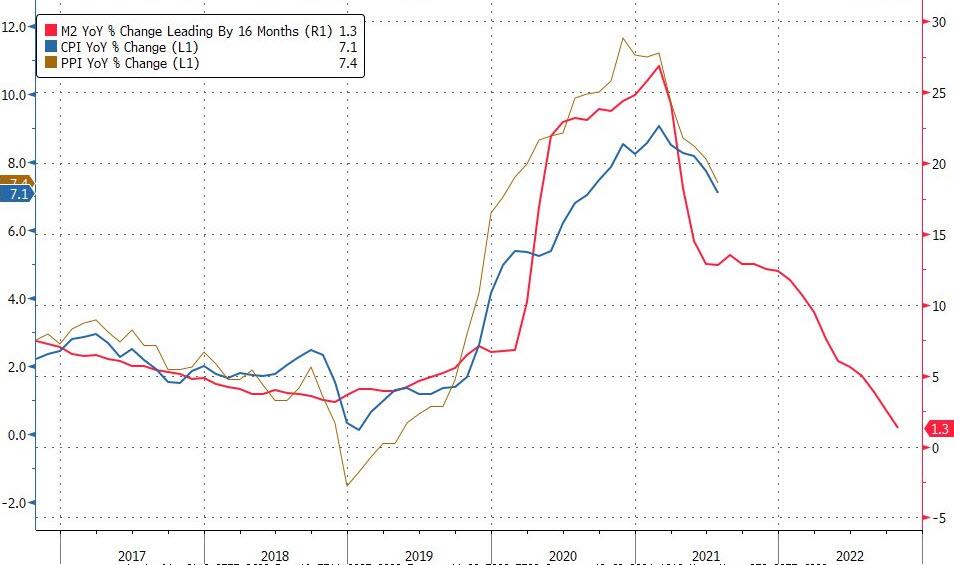
And given the violent rollover in M2, we suspect inflation will continue sliding...
Bear in mind that last month's (11/10/22) YoY headline CPI print came in soft @ 7.7% (vs 7.8% expected and 8.2% prior), and with traders short into the event, the S&P exploded +554bps (sharpest rally since April of 2020).
Additionally, the S&P's realized volatility into today's CPI print is the highest since 2009...

Ahead of today's print, both JPM and Goldman presented their market move forecasts, and indicatively a 7.1% print means the following for the S&P:
- JPMorgan: S&P gains +2%-3%
- Goldman: S&P gains +4%-5%
Finally, we note that real wages for Americans fell for the 20th straight month...
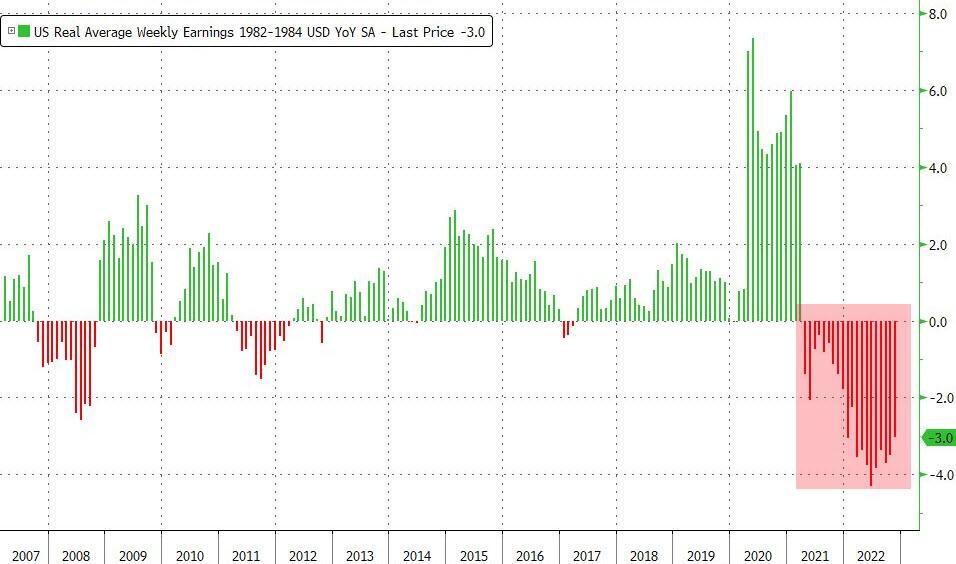
Source: Bloomberg
But hey, gas prices are down since the June peak, and 'strong as hell' economy, right?
By Zerohedge.com
More Top Reads From Oilprice.com:
- Is The Era Of Ever-Cheaper Lithium Batteries Over?
- Scientists Make Breakthrough In $40 Trillion Nuclear Fusion Push
- EU Reaches Deal On Carbon Tax For Imports


