


The oil price rally that began a year ago is at a crossroad. In February, WTI futures fell from a 3-year high of more than $66 to less than $60 per barrel but have since recovered almost 70 percent of that value.
Was this a temporary adjustment on the long march to $70 oil or have prices reached a ceiling at around $65 per barrel?
Oil Price Recovery 2017-2018
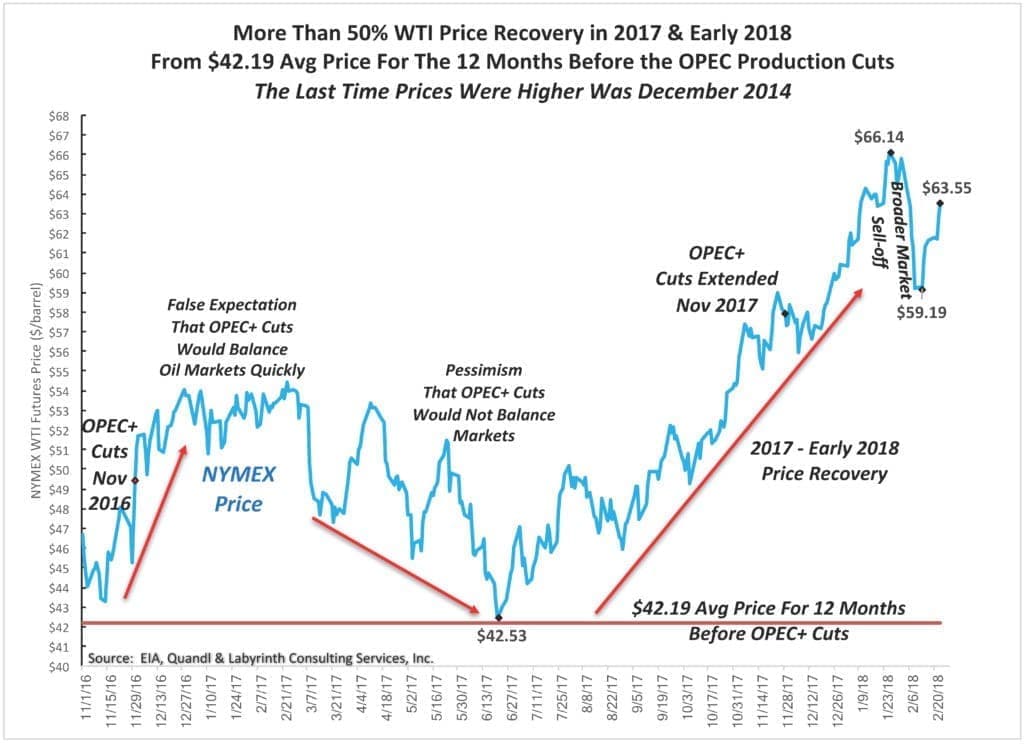
WTI averaged about $42 per barrel in the 12 months before OPEC+ production cuts began in November 2016. Prices increased immediately to more than $50 based on false expectations that oil markets would balance quickly (Figure 1). By March 2017, concerns developed that the cuts would not work and prices fell back to pre-cut levels by June.
(Click to enlarge)
Figure 1. More Than 50 percent WTI Price Recovery in 2017 & Early 2018 From $42.19 Avg Price For The 12 Months Before The OPEC Production Cuts The Last Time Prices Were Higher Was December 2014. Source: EIA, Quandl and Labyrinth Consulting Services, Inc.
At about the same time, global oil inventories began falling and prospects for economic growth improved. WTI increased fairly consistently to more than $66 by late January 2018. That represented a 57 percent increase and led to price levels that had not been seen since December 2014.
The recent drop in oil prices was probably more because of the broader market sell-off than because of oil market factors specifically. Some analysts dismiss the sell-off as a correction to over-valued equity markets along with concerns about inflation and higher interest rates. There is also a darker perspective that slow productivity growth, increased debt and higher commodity prices in addition to those factors are already limiting economic expansion.
How Oil Traders See Things
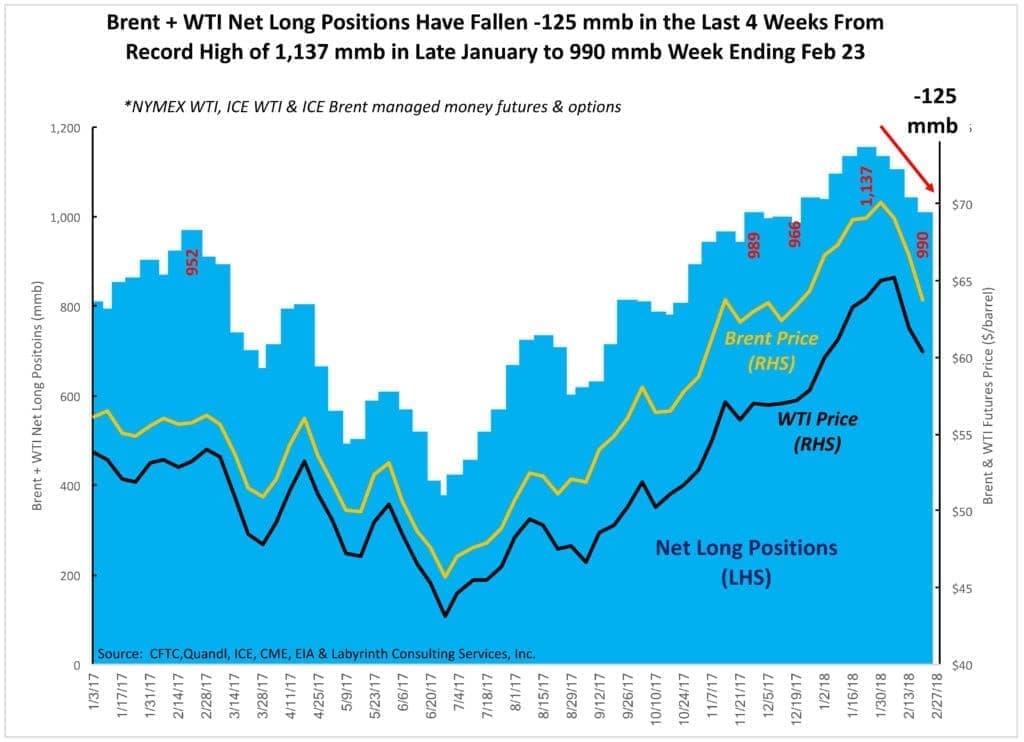
Managed money and hedge fund long bets on oil price have fallen 125 mmb from a record high in late January (Figure 2). Long positions still outnumber short positions by 11-to-1 but the shift marks an important change in sentiment by major capital providers and that affects the way that oil traders think about the market.
(Click to enlarge)
Figure 2. Brent + WTI Net Long Positions Have Fallen -125 mmb in the Last 4 Weeks From Record High of 1,137 mmb in Late January to 990 mmb Week Ending Feb 23. Source: CFTC, Quandl, ICE, CME, EIA and Labyrinth Consulting Services, Inc. Related: Peak U.S. Shale Could Be 4 Years Away
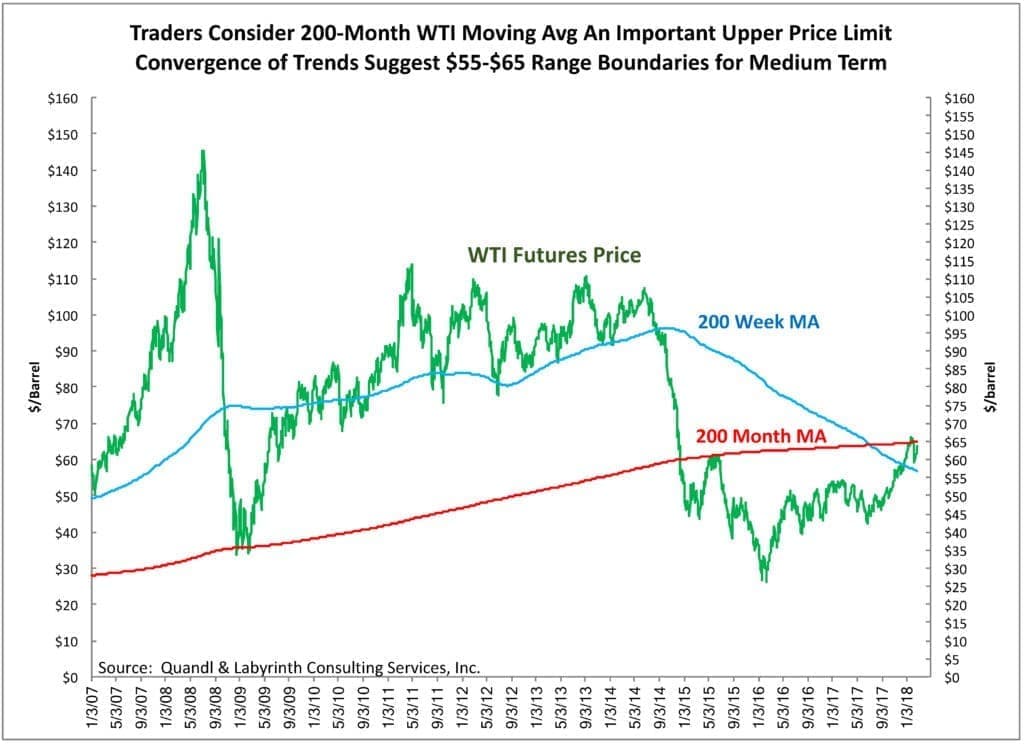
Some traders view the 200-month moving average of futures prices as an important upper limit at least for the short to medium term (Figure 3). The convergence of the 200-month average and other trends suggest $55 to $65 range boundaries going forward. Many believe that oil prices are more likely to fall than to rise.
(Click to enlarge)
Figure 3. Traders Consider 200-Month WTI Moving Avg An Important Upper Price Limit. Convergence of Trends Suggest $55-$65 Range Boundaries for Medium Term. Source: Quandl and Labyrinth Consulting Services, Inc.
Comparative Inventory and The Direction of Oil Prices
Comparative inventory (C.I.) is the difference between current storage levels of crude oil plus a select group of refined products, and their 5-year average for the same weekly time period. Because it is a year-over-year calculation, it normalizes seasonal variations in production, consumption and refinery utilization.
It is an indicator of oil over-supply and under-supply. It shows that the U.S. over-supply of oil has ended (Figure 4). C.I. has fallen 236 mmb since April 2015 and 209 mmb since February 2017. It is now only 3 mmb above the 5-year average. The last time C.I. was at the 5-year average in late November 2014, WTI price was $72.36 per barrel.

(Click to enlarge)
Figure 4. Comparative Inventory (C.I.) Is An Indicator of Oil Over-Supply & Under-Supply By Comparing Current Stock Levels With the 5-Year Average. C.I. Has Fallen 236 mmb Since April 2015 & 209 mmb Since Feb 2017. Source: EIA and Labyrinth Consulting Services, Inc.
Why is oil trading now in the low $60 range?
Figure 5 shows the same C.I. vs. price data as a cross-plot. The resulting “yield curve” (Bodell, 2009) offers a structure for organizing seemingly random variations in oil prices. The long-term yield curve (in black) has provided a useful solution for the complex market forces that relate inventory and price over the last 3 years.

(Click to enlarge)
Figure 5. Emerging C.I. – Price Yield Curve May Indicate 2018 Re-Pricing of WTI Or It May Represent a Temporary Phenomenon Resulting From Speculative Pressure & Bearish Market Sentiment. Source: EIA & Labyrinth Consulting Services-Aperio Energy Research.
Figure 5 also shows the possibility for a new 2018 yield curve (in blue) that may offer a better inventory-price solution going forward since current price is less than the long-term curve predicts. This new yield curve suggests that the mid-cycle WTI price may be $65 or lower instead of the higher price associated with the long-term curve.
This does not mean that prices will not exceed $65 per barrel. It means that $65 is the approximately correct price at the 5-year average. If C.I. becomes increasingly negative, prices should rise. Related: How The Fed Could Hammer Oil Producers
This is hypothetical and may represent a temporary phenomenon resulting from speculative pressure and bearish market sentiment. It may also indicate the market has re-priced WTI because of new market forces.
The IEA and EIA have promoted widespread belief that U.S. tight oil production will surge in 2018 and 2019. Producers and analysts claim that efficiency and technology have lowered break-even prices substantially below current benchmark levels. The market may have decided to believe those narratives.
If higher oil prices are what producers want and need, they should be careful about what they ask investors to believe. The market is rarely generous.
By Art Berman
More Top Reads From Oilprice.com:
- Oil Jumps On Libya Export Outage, Saudi Comments
- Crashing Cushing Inventories Boost Oil Prices
- Despair In Venezuela: “We Are Dying Of Hunger In The Oil Industry”


Always love reading your articles. Your oil price/C.I. yield curve graph is my favorite tool to assess the current market.
I honestly think the price is lower (than the long term curve) cause of the fear of a large market correction. Its hard for oil and depressed oil stock to rally in the teeth of an overbought market that is begging for a correction.
All the stars are aligned for oil: OPEC reductions and commitment; Venezuela debacle; Conventional depletion; Middle East tension; Lower Dollar and the most important: Growing Demand - and it still seems like the move higher is being done with two piano's on oil's back...
(yes, Shale growth is a factor - but way overrated...its only 5% of world supply!!!)
Best thing that can happen is a sideways stock market for a couple months and let oil breathe...
All the best Art-
Shark
Please remember that those January highs when CLH8, or March 2018 contracts were the front-month contract reached a high of $66.66 before all markets corrected and WTI went to just above $58/bbl.
Specifically for CLJ8 (April 2018) or the current front-month contracts, the high was $66.39. If you hold a long position (for any length of time), I would exit that position before prices hit that. However, this all depends on Tuesday afternoon's API report, followed by Wednesday morning's EIA report...if it's bullish, we'll reach that price this week; otherwise we'll continue this conversation perhaps next week.
You say that WTI can't break $65/bbl....that the long-term futures (reflecting marginal production costs) are falling.....that IEA/EIA say that shale oil is surging.
But.....shale production IS surging....and prices aren't rising for the futures curve....and the $100/bbl. costs of 5 years ago are clearly close to or below $50/bbl. (depending on how you define it).
You sem to be paying lip-service to the shale revolution and even show proof that it's real...but keep taking pot-shots at the industry with talk of "narratives" and the promotion of "widespread beliefs."
Do you REALLY think that the hundreds of geologists working for E&Ps are frauds ? Come on....
Let's be honest: if we had this debate 4-5 years ago, neither of us could claim for certainty what would be the ultimate outcome of the shale experiment. But today, after oil prices fell 50%, after Saudi Arabia and OPEC thought they could do to shale what they did to deepwater in the 1980's, only a zealot would say that shale isn't real.
It is.
If you repeat a claim regularly, the market may believe it for a short while but the truth always will out.
In the current global oil market situation, three major factors principally determine the oil price levels: the growth of the global economy projected to rise at 3.9% in both 2018 and 2019 according to the IMF, the global demand for oil projected to rise by almost 2 million barrels a day (mbd) this year and the re-balancing of the global oil market which is almost complete.
In view of the above, it is difficult to set a ceiling for oil prices particularly if they were to be buoyed by rising geopolitical tension around the world. In my considered opinion, Brent oil prices are heading towards $70/barrel possibly even reaching $75 in 2018 and $80 by 2019. Similar growth is also anticipated for the WTI.
The EIA and the IEA in cahoots did their utmost during 2017 to cap the oil price at $60 but failed. They are now trying to cap it at $70 and they will fail again. The $60 has become the floor for oil prices in 2018 but the cap will be determined by market forces.
Dr Mamdouh G Salameh
International Oil Economist
Visiting Professor of Energy Economics at ESCP Europe Business School, London
Perhaps using a five-year median for comparative inventory would be more robust and resolve this apparent shift in curve.
If my view is correct, it also implies that the five-year average itself must be worked off in coming years. Essentially, the market is still holding more in inventory than is economically optimal. Should interest rates increase, this long-term excess five-year average inventory could become less tolerable as the cost to carry rises. Additionally, as the EVs and other technologies encroach upon oil demand growth, a large long-term inventory may become less desirable to hold. So for several reason, long-term inventory may still be too high and headed ultimately for lower levels.
Crude oil remains the most efficient means of reducing the cost of production and the cost to bring it to the surface have declined dramatically and there is more competition in the past. This economic renaissance translated into zero income growth, fewer jobs in a recovery, and zero interest rates. A massive increase in the supply of oil reduces the potential value of human labor.
Higher crude oil prices should be welcomed by all.
Shale growth is EXPLODING -- if you doubt this, go ask the Saudis or Russians.
(2) Yes Shale is only 5% of global supply...but 5% is enough to swing prices. Heck, 2% is enough. Price is set at the margin.
(3) Bank of America says that the Permian could be producing close to 7 mm/bbl/day by 2022, eclipsing Ghawar as the largest field in the world.
I do agree that oil is likely to go higher eventually, but you can believe that and still think shale is the real thing. I think OPEC/Saudis/Russia all control production....1-time outages start to re-appear (Venezuela, Libya, Nigeria, Norway, etc.)...natural depletion...stronger GDP and oil demand.