


This is a guest post by Ovi here.
All of the oil production data for the states comes from the EIA?s Petroleum Supply Monthly.
The charts below are updated to September 2019 for the largest US oil producing states (>100 kb/d).
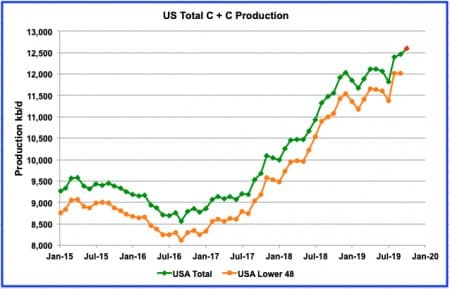
There continues to be much speculation and information pointing to a potential slowing of US oil production. However the latest production data from the EIA continues to point higher, albeit at a slower rate.
US C + C production reached a new high of 12,463 kb/d in September according to the November EIA 914 report. Looking forward to October production, the November Monthly Energy Review (MER) estimates US production for October to be 12,600 kb/d, an estimated increase of 137 kb/d, shown in red as the last data point.
The initial growth estimate for 2019 indicates a slower growth rate for 2019 vs 2018. In 2018, growth to September 2018 was 1,432 kb/d. For 2019 it is 426 kb/d, ~30% of the 2018 growth rate. So while US production is growing, yearly growth is slowing.
However it needs to be noted that there was no increase in September production relative to August in the L48 states. A number of increases in Texas, New Mexico and Oklahoma were offset by large decreases in the GOM (-114 kb/d) and North Dakota (-40 kb/d) that led to no growth. Related: Why Oil Prices Just Jumped
US Oil Production by State

Listed above are the 10 states with production greater than 100 kb/d. These 10 account for 10,106 kb/d (81%) of total US production of 12,463 kb/d in September.

In September, Texas production continued to rise and rose by 72 kb/d to 5,227 kb/d. Again, comparing the initial growth estimate for Texas for 2019 vs 2018 indicates a slower growth rate for 2019. In 2018, growth to September 2018 was 729 kb/d while for 2019 it is 331 kb/d, ~45% of the 2018 growth rate.
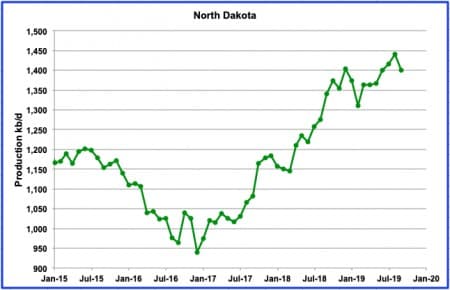
North Dakota’s September production is down by 40 kb/d due to heavy rain according to the Star Tribune. According to Shale Profile, ND added 119 new wells in September but these were not enough to overcome the legacy decline. For 2019, average peak production for ND wells is 713.9 b/d, according to Shale profile.

New Mexico’s September production increased by 21 kb/d to 956 kb/d. This is about half of the August increase and could be related to storm/weather activity.
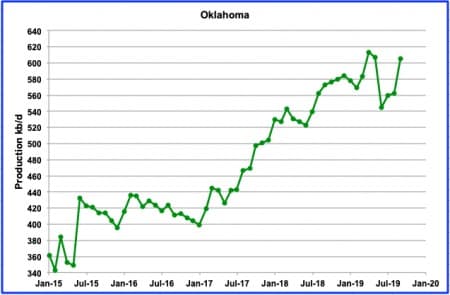
Oklahoma’s September production increased by 43 kb/d to 605 kb/d. This is a large increase relative to production from June to August. What is surprising is that a June report indicated a loss of interest by drillers in Oklahoma. According to the headline in Reuters, “Interest dims in Oklahoma shale play as drilling results disappoint“. Apparently the geology has stymied hopes for a “Permian Jr”: “Exploration wells pointed toward uniform rocks that produced high levels of oil, but producers instead encountered more complexity underground, and production weighted toward gas – at a time of a global glut and stubbornly low prices for the commodity.”
While production is still lower than the April high, we will need to wait to see if production is on a plateau or will increase further.
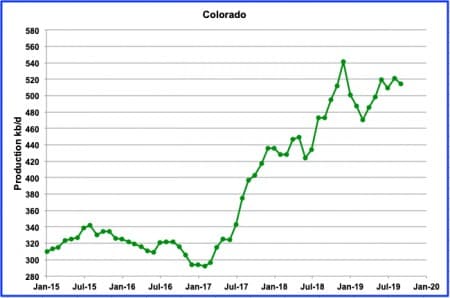
Colorado’s September production has been on a plateau since June between 510 kb/d and 520 kb/d possibly due to new regulations. However according to the Colorado CPR news, All systems are “Go” for Colorado oil and gas.

Alaska’s September production increase is associated with the end of summer maintenance. The November MER is predicting a further increase to 477 kb/d for October. However the September number is being questioned by the Alaska Frontiersman. They claim that “Oilfield operators produced an average of 478,756 barrels per day in September and October, compared with 505,822 barrels per day for the same months of 2018, according to the data.”
The answer to the question of whether Alaska production will exceed 500 kb/d this year requires a few more months of production data.
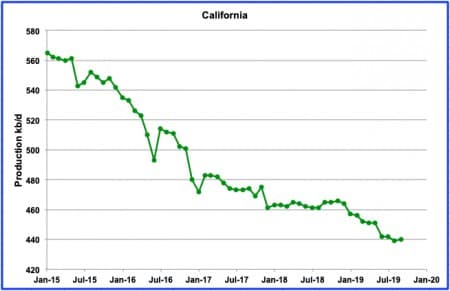
California production has been flat since June at 440 kb/d. Since 2017, production appears to be going through a step process of a flat period and then a ramp down. Bottom line is that there is little sign of recovery.

The northern portion of the Niobrara LTO basin is situated in Wyoming. The sharp increase in Wyoming production from January 2017 is directly related to increased drilling in the Niobrara. One year ago September, on average Wyoming had 30 rigs operating. As of September 2019, it has increased to 35. We should expect to see production increasing. However, in November there are only 31 operating. It will be interesting to see if production decreases. For all of the Niobrara, September production increased by 9 kb/d. Wyoming by itself increased by 10 kb/d.

Louisiana had a production recovery in August but it did not continue into September.

Oil production in Utah started to increase in 2016 after the discovery of a new conventional oil field. However, Utah’s production may now be entering a plateau period or declining phase.

The GOM experienced a production drop of 114 kb/d in September. However, according to an article in Rigzone: “Eight new deepwater projects are expected to come online this year while four should come online in 2020. Majority operators for the 2019 starts include LLOG, Shell, Oxy, Murphy Oil and W&T Offshore. Talos Energy, BP, Murphy Oil and Fieldwood Energy are majority operators for the 2020 starts.
The agency (EIA) expects these projects in total to add around 44,000 bpd this year and approximately 190,000 bpd in 2020 as their production ramps up.”
So far in 2019, the top contributors to supply growth have been the Big Foot and Crosby fields, but the Appomattox field is expected to make a significant impact by the end of the year by ramping up towards its processing capacity of 175,000 barrels of oil equivalent per day.
Despite the addition of a total 234 kb/d of new production in 2019 and 2020, the STEO does not expect the GOM production to exceed 2,050 kb/d in the first half of the year before seasonal maintenance will drop production below 2,000 kb/d.

Above are the top US states and GOM plotted on the same scale.
Drilled but Uncompleted wells (DUCs)

This chart shows the number of DUCs in the five major oil producing LTO basins. Much discussion surrounds how production of LTO continues to increase while the number of rigs operating in the LTO basins continues to decrease. One of the reasons given is that the higher production rate tier 1 DUCs (Sweet spots) are being completed along with some lower rate Tier 2 and 3s to keep production growing. However as the number of tier 1 DUCs decreases, it is expected that the growth in LTO production will peak and the begin to decline. As of November, DUCs are down by only 8.2% from a peak of 7,566 in May 2019.
Two Projections: The first Near term and the second slightly longer
Projection 1

The EIA DPR report looks ahead to provide guidance on production from the US tight oil basins. However, it should be noted that the DPR includes regular oil in their production data whereas the EIA LTO report only provides data on US LTO production. The gap between the green and red lines in the above chart reflects the net production increase for that month. Related: The Pipeline Threatening A U.S.-China Trade Deal
In the chart, the projected increase for December is 48.2 kb/d. Also it can be seen that the EIA’s projected monthly net increase has been getting smaller since August 2019 and the volatility is gone. Maybe the DPR has better and more up to date production information from these nearer term months. Time will tell.

This chart shows the difference between the monthly production growth and the monthly decline in the previous chart. In other words it is the DPR’s projected Net monthly production increase for the seven LTO basins starting in January 2018. While the volatility is quite high up to July 2019, after August 2019 the volatility decreases and seems to have taken on a more linear trend. A straight line fit of the monthly net production from the tight oil basins starting in September has been added to the chart. (Note: The red line has been slightly shifted so the underlying data can be seen). If the decrease were to continue at the rate of 21.8 kb/d/mth, there would be no net increase in production from the LTO basins after March 2020. (To be really precise it is actually February 4 and don’t tell anyone) It will not take long to see if this projection is wrong. Also it will not be the last of more to come.
Projection 2

Above is a quadratic curve fit projection out to mid 2021 of the STEO L48 production data up to December 2020. The quadratic is giving a strong indication of a peak around the middle of 2021. The STEO data shows an intermediate peak in May 2020 which could be the high if the bump up from the GOM in November 2020 does not materialize. The September and October declines could be simply EIA guesstimates associated with hurricane interruptions.
US Natural Gas Plant Liquids

While the focus of this post is on US C + C production, we cannot ignore the increasing amounts of NGPLs being produced in the US. When the IEA and OPEC report on US oil production, they also include the NGPLs. Adding the two, total oil US production for September would be 17,452 kb/d. Since Jan-17, NGPLs production has been growing at the rate of 44.26 kb/d/mth.
I should note that the large increase in September NGPLs shown in the chart is correct as taken from the EIA NGPLs sheet. However the EIA weekly data for September shows an average production of 4,820 kb/d as opposed to 4,989 kb/d shown in the September EIA monthly data.
World Crude + Condensate Production

World Oil C+C production increased by 962 kb/d in August with 752 kb/d being provided by Non-OPEC countries. A more detailed update of world oil production will be provided later this month.
More Top Reads From Oilprice.com:
- The Complete Guide To Drilling
- Tesla’s Largest Competitor Is Hidden In Plain Sight
- Why Oil Prices Just Jumped


