


Upstream companies that get the majority of their revenues from the sale of natural gas and the associated natural gas liquids have been out of favour for at least three years. However, the “Gassers” that I follow closely are some of the most profitable companies on my Watch List. If you are a contrarian investor, maybe now is the time to add some shares of high quality natural gas producers while they are on sale. I believe the North American natural gas market is setting up for a significant price spike in just a few months.
(Click to enlarge)
Colder than normal weather in the Great Lakes Region has caused draws from U.S. natural gas storage for the first three weeks of April. Per the U.S. Energy Information Administration’s (EIA) report for the week ending April 20, 2018, natural gas in storage is now 527 billion cubic feet (Bcf) below the 5-year average and 897 Bcf below where storage levels were at the same point last year. Draws from storage usually end in March, but this “Winter that Never Ends” in the Northeast quarter of the United States has resulted in 73 Bcf being drawn from storage when the 5-year average for the first three weeks of April is a build of 130 Bcf.
It is a good bet that we will get to April 30th with over 900 Bcf less gas in storage than we had last year. It will be one of the largest year-to-year differences in U.S. natural gas in storage on record. The colder than normal winter has been responsible for some of the deficit, but clearly non-weather related demand for gas has been and remains much higher than EIA was forecasting.
When natural gas is produced it enters the midstream gathering, processing, distribution and storage system. Natural gas liquids (NGLs) are extracted from the raw gas stream. The dry gas is consumed, primarily for industrial demand, space heating and power generation or it is exported via pipeline or as liquified natural gas (LNG) via ship. The difference between supply & demand goes into the massive U.S. storage system, which can hold over 4.2 Trillion Cubic Feet (TCF). EIA’s weekly storage reports prove that demand over the last twelve months has exceeded supply by a rather significant amount; more than 800 Bcf compared to the 5-year average for the recent 52-week period ending April 20, 2018.
Smart Investor buy stocks when they are out of favor and sell them at higher prices
The fact that natural gas in storage is at a historically low level does not mean the price of natural gas will go up anytime soon, primarily because we are in a seasonally low demand period. However, storage must be refilled before the next winter heating season arrives. Our colder than normal April weather has shortened the refill season by a month. At the end of April utility companies will only have six months / 184 days (May to October) to build up enough natural gas in storage to meet residential and commercial demand for space heating.
If the next winter begins with storage under the 5-year average it can get wild in the spot market. The oil and natural gas prices you see quoted on the business news each day are the prices of the front month NYMEX contract. The “Spot Market” is where utility companies and industrial users must go if they run short on physical supply. The utility companies that supply the natural gas to heat most of the homes and businesses in the U.S. literally CANNOT RUN OUT OF GAS. I’ve seen gas sell in the Northeast market for over $100/MMBtu during a harsh winter. I believe there were some spot market sales over $60/MMBtu in December, 2017.
During the winter months Illinois, Michigan, Ohio, Wisconsin and Minnesota are the five states that consume the most gas for space heating. Texas ranks #6 and we’ve had a rather cold spring so far down here in the Lone Star state. In the summer, the South becomes the top consumer of natural gas.
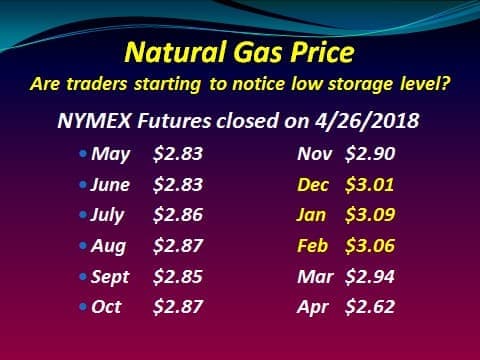
If weather across Texas and the South, where there are hundreds of gas fired power plants, gets HOT this summer (a fairly good bet), we may see utility companies bidding up the NYMEX futures contracts. On April 26th the January 2019 NYMEX contract for natural gas closed at $3.09/MMBtu. In December, 2017 a brief cold spell at the beginning of the winter heating season caused the front month contract to spike to over $3.60/MMBtu. If we get to Thanksgiving this year with several hundred Bcf less gas in storage than a year ago, it is a good bet that natural gas traders will take the commodity price a lot higher when the first cold wave approaches Chicago.
After the EIA storage report on April 26, 2018 there seemed to be a bit more interest among the commodity traders in natural gas as the NYMEX futures prices moved higher on higher than normal volume. However, the trading of crude oil futures dwarfs still dwarfs the trading activity in natural gas.
(Click to enlarge)
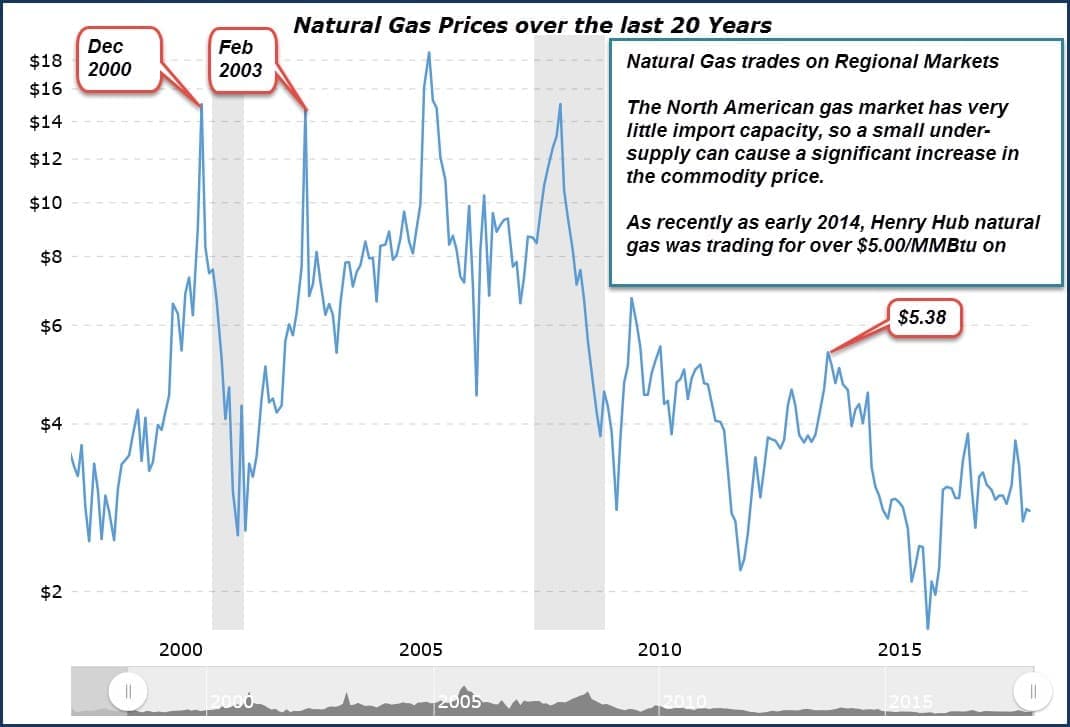
Wall Street has very little interest in the “gassers” today. However, the Wall Street Herd can change direction quickly, especially when it comes to natural gas. Go look at a twenty year chart for natural gas (above) and you will see that there have been MAJOR natural gas price spikes in the not too distant past. I can testify that just a few months before those four big spikes, especially the ones in December, 2000 and February, 2003 that no one believed that natural gas would soon be trading at over $14.00/MMBtu.
I have no idea where natural gas prices will be in six months, but in my opinion, today’s gas prices seem way too low considering how much gas has been drained from storage over the last six months. I certainly don’t expect gas go over $10.00/MMBtu, but a move back to over $3.50/MMBtu would make a lot of upstream gas company stocks look extremely attractive.
Before we talk about two of my favourite gassers, here are a few things to remember about the U.S. natural gas market:
• Demand for U.S. natural gas is growing much faster than the demand for oil.
• Natural gas is a very cheap form of energy today. Six MMBtu of natural gas has about the same energy content as one barrel of oil. If it traded on that basis, natural gas would be selling for over $11.00/MMBtu.
• The U.S. economy is now very dependent on a steady supply of natural gas, especially in the winter months. Natural gas fired power plants now generate over a third of our electricity.
• The U.S. is almost a closed gas market; the country has relatively little import capacity. The volume of gas that we get from Canada is fairly steady. Exports of gas via pipeline and as liquefied natural gas (LNG) already exceed our import capacity.
• Each year, more areas of the country rely heavily on natural gas for electricity because we have shut down a lot of coal fired power plants.
The natural gas liquids (NGL) market tightened in the 4th quarter of 2017 with NGL prices coming in higher than my forecasts for all of our model portfolio companies. NGL prices have pulled back 5 percent to 10 percent in the first quarter, but the NGL market is in much better shape than it was a year ago.
I follow about a dozen upstream companies that get the majority of their revenues from the sale of natural gas and NGLs. In my opinion, they are all trading today below breakup value. Two of them have already reported first quarter results that beat my forecast, so I feel comfortable bring these high quality and profitable companies to your attention.
Antero Resources Inc. (AR) is an upstream company that I have been following closely for over five years. Its core area of operations is in the Marcellus and Utica shale plays in the Appalachian Basin. During the time that I’ve tracked the company’s growth it has increased production by approximately 20% annually. They recently announced a 5-Year plan to increase production by an 18% compounded annual rate. It is the safest bet on natural gas because it has 100% of its natural gas production hedged through 2019 at prices above the current NYMEX strip. During the first quarter, Antero’s natural gas sold at $3.85/Mcf when the cash settlements on their hedges during the quarter are included.

(Click to enlarge)
Antero’s management team has extensive experience delineating and developing natural gas and NGL resource plays to profitably grow reserves and production, primarily on their existing multi-year project inventory. The current portfolio comprises long-lived properties that are characterized by management as having low geologic risk and repeatability.
For 2017 Antero Resources reported earnings per share of $1.95 and cash flow from operations of $6.12 per share. Based on my forecast model, they will meet or exceed those numbers in 2018 even if natural gas prices stay right where they are today. In my opinion, a company of this quality should be trading for at least 6X annual operating cash flow per share.
On April 25, 2018 Antero Resources announced 1st quarter, 2018 results.
• Production of 2,376 MMcfe/day exceeded my forecast
• Production mix was approximately 74.0% natural gas, 24.5% NGLs and 1.5% crude oil
• Antero is on-track to meet their guidance of 20% year-over-year production growth
• Adjusted earnings per share (non-GAAP) for the quarter of $0.44/share beat First Calls’ estimate
• Operating cash flow for the quarter, before changes in current assets and liabilities was $485.5 million
This company has a lot of running room. Antero has over 6,000 potential horizontal well locations on existing leasehold acreage, both proven and unproven. The company has also secured sufficient long-term firm takeaway capacity on major pipelines that are in existence or currently under construction in each of the core operating areas to accommodate current development plans. Antero operates in the following industry segments: 1) the exploration, development and production of natural gas, NGLs, and oil, 2) gathering and compression, 3) fresh water distribution, and 4) marketing of excess firm transportation capacity.
Antero Resources holds the controlling interest (~53%) in Antero Midstream (AM), one of the fastest growing midstream companies in Appalachian Basin.
Another one of my favorite “gassers” is Range Resources (RRC), a major gas producer in the Appalachian Basin with a second core area in Louisiana.
Range is the first company to prove that Marcellus shale gas could be produced at a profit thanks to horizontal drilling and multi-stage fracing. Today they hold over approximately 1.5 million net acres in the Marcellus/Utica shale plays. Most of their leasehold is now held by production and they have thousands of low-risk high-return development drilling locations; many of them from existing pads.
Both Antero and Range have outstanding marketing groups. They have secured takeaway capacity on several major pipelines that serve the Appalachian Basin, so they can get all of their production to good markets for both natural gas and NGLs. Range also has an active hedging program that has locked in good prices.
On April 25, 2018 Range Resources announced solid 1st quarter, 2018 results.
• Production averaged 2,188 Mmcfe/day that was slightly above my forecast
• Production mix was approximately 68.5% natural gas, 28.2% NGLs and 3.3% crude oil
• Range is on-track to meet their goal of 11% year-over-year production growth in 2018
• Adjusted earnings per share (non-GAAP) for the quarter of $0.46/share beat First Calls’ estimate
• Operating cash flow for the quarter, before changes in current assets and liabilities was $316.0 million
For 2017 Range Resources reported earnings per share of $1.36 and cash flow from operations of $3.52. Based on my forecast model, Adjusted Earnings per share for 2018 should by about the same and cash flow from operations should be over $4.00 per share.

(Click to enlarge)
Antero Resources and Range Resources both have strong balance sheets with more than enough liquidity to fund their growth plans. Even if natural gas prices track where the NYMEX strip is today, they are both expecting to generate free cash flow in 2018. If gas prices do move higher, these companies will be among the first to draw attention from Wall Street.
By Dan Steffens or Oilprice.com
More Top Reads From Oilprice.com:
- The One Man Who Could Send Oil To $100
- Oil Prices Steady As Geopolitical Risks Calm
- A Natural Gas Giant Like No Other


