


I have updated my scenarios for U.S. LTO output, based on both EIA tight oil output data and average well profile data from Enno Peters’ shaleprofile.com. I have also created a scenario for the Niobrara shale oil play and for “other U.S. LTO” which excludes the Permian Basin LTO, Eagle Ford, North Dakota Bakken/Three Forks, and the Niobrara.

(Click to enlarge)
niobrara play
The recent Niobrara wells have an estimated ultimate recovery (EUR) of 143 kb. The oil price scenario below is used for all of the scenarios.

(Click to enlarge)
Well cost is assumed to be $4.5 million in 2017$. The scenario below assumes EUR starts to decrease in Jan 2019 as sweet spots become fully drilled. Economically recoverable resources (ERR) to 2040 are 2.7 Gb with 21,000 total oil wells completed, peak output is 623 kb/d in early 2021.
Related: OPEC May Ease Oil Cuts As Soon As June
Fewer wells are completed relative to the North Dakota Bakken and Permian Basin because the wells are less profitable.

(Click to enlarge)
other u.s. lto
For U.S. other LTO, much of the output is from condensate from gas wells so the analysis is more approximate and a discounted cash flow analysis is beyond the scope of this post, the “average well” produces only about 38 kb over its life, but in many cases the output of natural gas makes the well profitable, there are some areas where shaleprofile.com does not have data such as the Anadarko basin, so I have simply taken the average well profile for areas covered (excluding ND Bakken, Eagle Ford, Permian and Niobrara) and then found the number of these “average wells” that fit U.S. other LTO output data from the EIA (including Anadarko). The true average well profile for all areas including Anadarko is unknown.
The scenario below should be considered very preliminary, actual output might be much higher or lower than suggested by this scenario. TRR is 3 Gb from 70,000 wells completed and peak output is 426 kb/d in mid-2020. For comparison U.S. other LTO output was 385 k/d in Feb 2018, so increased output from other U.S. LTO plays may be quite small in magnitude.

(Click to enlarge)
north dakota bakken scenario
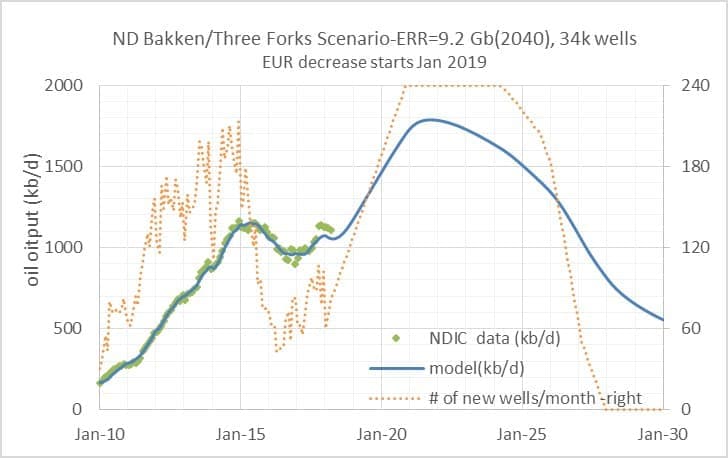
(Click to enlarge)
eagle ford scenario
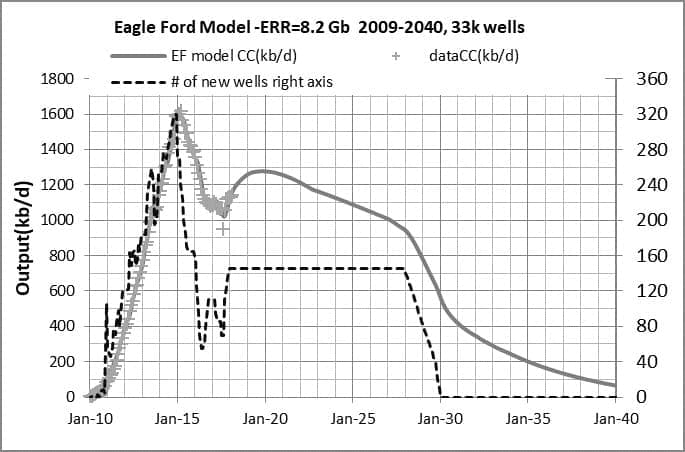
(Click to enlarge)
The ROI for Eagle Ford wells is much lower than Permian or Bakken wells which accounts for wells added per month remaining far below the peak level, ERR=8.2 Gb with 33,000 total wells completed, in Jan 2020 output is 1277 kb/d. Like the ND Bakken and Permian scenarios, it is assumed for the Eagle Ford that new well EUR starts to decrease in Jan 2019.
permian basin lto
ERR is 28 Gb through 2040 with 103,000 wells completed, peak is 4246 kb/d in 2024.

(Click to enlarge)
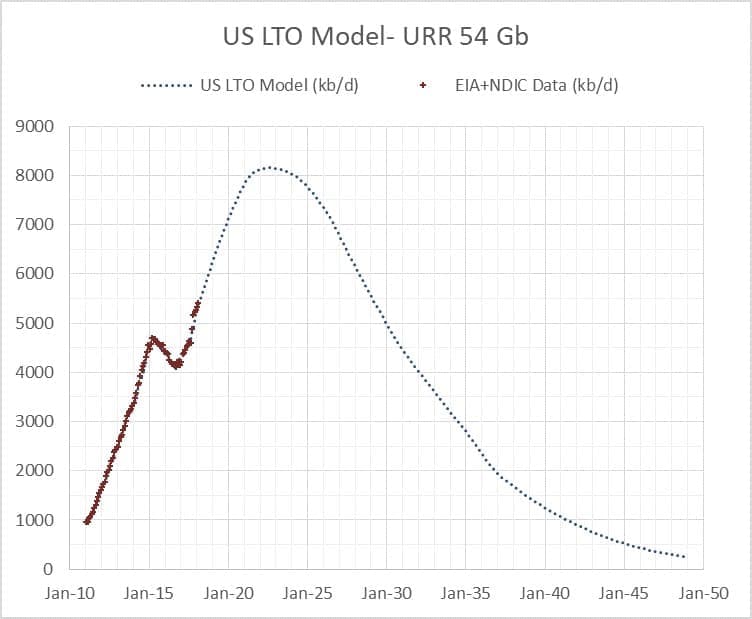
For all U.S. LTO we add up these 5 scenarios to get the chart below.
Related: Oil Slides As Saudis, Russia Consider 1 Million Bpd Output Boost
Peak is 8152 in July 2022, URR to 2050 is 54 Gb.
(Click to enlarge)
Chart below shows the contribution of the various plays to the total (horizontal axis ends in 2041 rather than 2050).
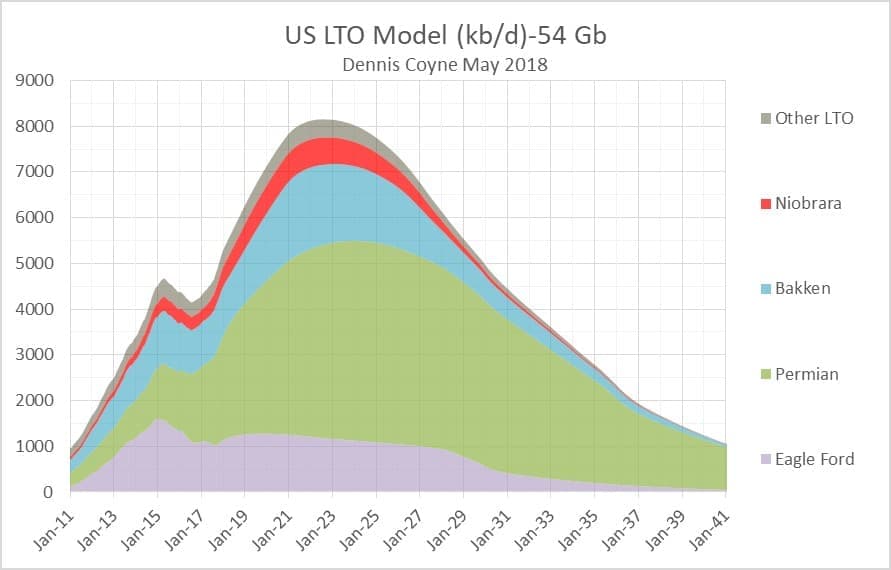
(Click to enlarge)
The scenario presented above lines up with the USGS mean estimates for the Permian Basin and North Dakota Bakken and David Hughes most likely scenario for the Eagle Ford in terms of URR. Reasonable guesses for the Niobrara and other U.S. LTO were made based on EIA tight output data and well data from shaleprofile.com and these will be updated as more information becomes available. Higher or lower scenarios could be created with URR from 45 to 65 Gb and peak years between 2020 and 2025 and peak output between 7000 and 9000 kb/d. In my view, U.S. LTO has about an 80% probability of falling within the low and high scenarios outlined above.
More Top Reads From Oilprice.com:
- Shell Makes Large Deepwater Discovery In Gulf Of Mexico
- Oil Prices Fall Despite Iran, Venezuela, Libyan Supply Outages
- Is $70 Oil Enough For Shale Drillers?


Hope that you can keep tracking and regularly bring it up to the people:)
In fact, more and more shale oil and gas are exporting into the Asia since end of 2016. Last year, the exporting quantity of shale oil and gas had hit the highest.
This year, there will be no doubt that the shale gas and oil will be more and more exporting into the Asia esp China, S.Korea, Japan, Vietnam, Taiwan etc This year, the US oil exporting quantity will hit the highest again, and it will continue by 2022yr.
It means that the US$ will be going weaker and weaker against those Asian currencies esp Korean Won, Chinese Yuan, Japanese Yen, TWD etc however Aussie$ NZ$ Singapore$ H.K$ will be depreciated against US$ due to US oil exporting through the Pacific Ocean:)
By the end of 2018, US will be the 1st oil producer in the world.
We had better hope global oil production doesn't peak for another 20 years, or more. Soon after it begins to decline, things will get unpleasant, as the economy is forced to shrink, putting pressure on the banking system.