


The OPEC Monthly Oil Market Report is out production data for January 2018. All data, unless otherwise noted, is through January 2018 and is in thousand barrels per day.

OPEC crude only production has held steady for three months. However, this chart masks the fact that November production was revised downward by 45,000 barrels per day and December production was revised downward by 107,000 barrels per day. January production was 76,000 barrels per day below last year’s 12-month average of 32,378,000 barrels per day and 247,000 barrels per day lower than OPEC’s 2016 12 month average of 32,549,000 barrels per day.

OPEC oil production was down just 8,100 barrels per day in January. November production was revised down 45,000 bpd and December production was revised down by 107,000 bpd. The largest revisions were for Venezuela. Their production was revised down 28,000 bpd in November and 98,000 bpd in December.

Algeria, like at least 8 other OPEC countries, is in continuous decline.

Angola peaked in 2008 at a 12-month average of 1,870,000 barrels per day are currently about a quarter of a million barrels per day below that number.

Ecuador’s crude oil production increased steadily for four and one-half years, from mid-2010 to January of 2015 and has been on a bumpy decline for the last three years.

Equatorial Guinea’s chart speaks for itself. I really don’t know why they joined OPEC. Their production is clearly in decline but is not enough to make much difference either way.

Everything I said about Equatorial Guinea can also be said about Gabon.

Iran is obviously ignoring any OPEC request to cut production and are producing every possible barrel they can.

Iraq’s 12-month average peaked, so far, last year, at 4,440,000 barrels per day. Their January crude oil production was 5,000 barrels per day below that average. Are they deliberately cutting production? If so, not by much.

Kuwait’s chart looks strange to my eye. I believe Kuwait is one of two, and possibly three, OPEC countries that could increase production somewhat. The others are Saudi Arabia and possibly the United Arab Emirates.

Libya is struggling. If peace ever breaks out in Libya they could increase production somewhat. But peace doesn’t seem to be on the horizon in Libya.

Nigerian crude oil production has a general downward trend. How much of this trend is due to political problems? Some of it, no doubt. But definitely not all of it.

Qatar peaked in 2008. And I won’t say “so far” here. They are clearly in decline.

Saudi crude oil production has been holding steady for 13 months now. Saudi is the only OPEC nation that could increase production by any considerable amount. They could possibly increase production from one quarter to one half million barrels per day. But likely a lot closer to one quarter million per day… possibly.

The UAE is one of the other two OPEC nations that just might be able to increase production somewhat. But I have more doubts about the UAE than I do about Kuwait.

Venezuela is in the grasp of a full-fledged collapse. Their production has fallen 273,000 barrels per day in the last three months. Their November production was revised downward by 28,000 barrels per day and their December production was revised downward by 98,000 barrels per day.
Venezuela is in danger of becoming a totally failed state, like Somalia. The worse things get, the worse things get. That is falling income from oil exports increases the chance that production will continue to fall. All income from exports will have to be used to keep the public from total rebellion and none will be left for the oil fields.

Looking at a zero-based chart puts OPEC crude only production in a much clearer perspective. 2018 on this chart is January only. The point here is that so-called “OPEC cuts” are not making much of a difference. World oil production is on that proverbial bumpy plateau.
(Click to enlarge)
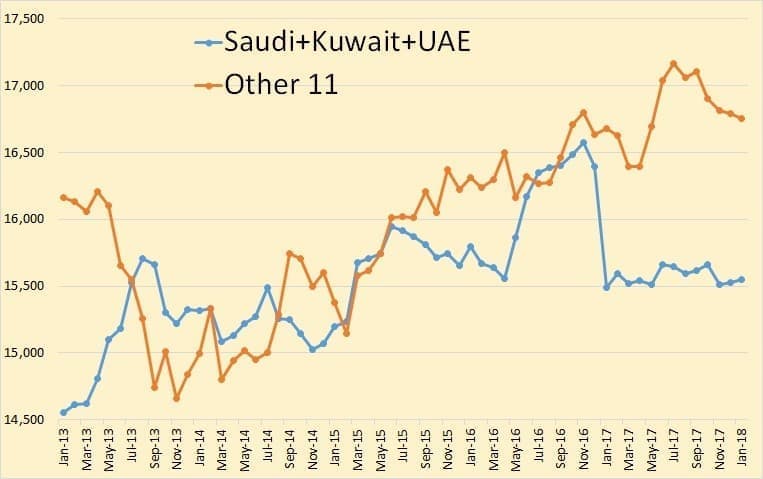
Saudi, Kuwait and the UAE began to increase production in May of 2016 and peaked in November of that year. The other 11 OPEC countries peaked in July 2017, seven months after the OPEC cuts began. They were all, at that time producing flat out. And in my opinion, still are.
Although the three OPEC countries, Saudi, Kuwait and the UAE, are likely capable of increasing production, they, in my opinion, can in no way increase production to what they were producing in late 2016. That was a period where they made heroic efforts to increase production in order to establish a point from which they could “cut” production. That level was then, and is now, unsustainable.

And if you remove Venezuela from the mix, then the combined production of the other 10 are at an all-time high, or nearly so. The increase in production of the countries represented in this chart, for the last two years, has been all Iran recovering from sanctions and Libya recovering from rebel attacks. Iraq has been relatively flat over the last two years and everyone else has declined.

OPEC production in the above chart is crude only. It does not even include condensate. But world supply here is total liquids. So, they are comparing apples to oranges. Natural gas liquids, in the last few years, have increased far more than crude oil alone.

The above chart is from the EIA and is only through October 2017. World C+C has been on a bumpy plateau since July of 2015.

This is Russia thru January 2018. The data is from the Russian Minister of Energy. The data was in tons and I am using a conversion factor of 7.3 barrels per ton.
By Peakoilbarrel.com
More Top Reads From Oilprice.com:
- Clean Oil That Only Costs $20
- Russia Is Taking Over Syria’s Oil And Gas
- An Eastern Mediterranean Offshore Gas War Is Brewing


