


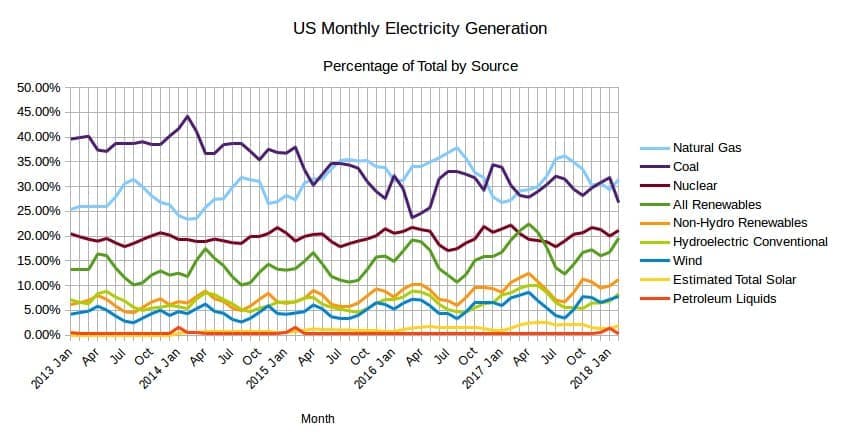
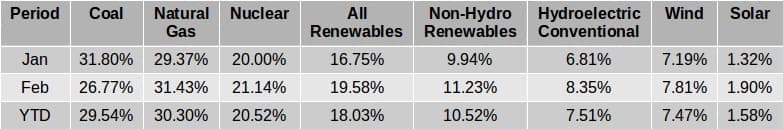
The EIA released the latest edition of their Electric Power Monthly on April 24th, with data for February 2018. The table above shows the percentage contribution of the main fuel sources to two decimal places for the last two months.
(Click to enlarge)
(Click to enlarge)
With the spring equinox drawing closer, the absolute contribution from Solar continued to climb from it’s low in December rising from 4917 GWh in January to 5812 GWh, with the corresponding percentage contribution climbing to 1.90 percent as opposed to 1.32 percent in January. Nuclear generated 64790 Gwh, 13 percent less than it did in January but, the decrease in total generation resulted in the percentage contribution to the total increasing to 21.14 percent from 20 percent in January. The gap between the contribution from
All Renewables and Nuclear continued to narrow in February with the 1.14 percent increased contribution from Nuclear as opposed to the 2.83 percent increase in the contribution from All Renewables resulting in a difference of 1.56 percent. The amount of electricity generated by Wind decreased by about 10.8 percent, (2898 GWh) but as a result of the reduced total generation, the percentage contribution increased from 7.19 percent to 7.81 percent. The contribution from Hydro increased 171 Gwh (0.76 percent) in absolute terms with the decrease in total generation resulting in the percentage contribution increasing by 1.54 percent.
The combined contribution from Wind and Solar increased to 9.71 percent from 8.51 percent in January and the contribution from Non-Hydro Renewables also increased to 11.23 percent from 9.94 percent. The contribution of zero emission and carbon neutral sources, that is, nuclear, hydro, wind, solar, geothermal, landfill gas and other biomass increased to 40.72 percent from 36.75 percent in January.
Related: Is The Golden Era For Renewables Around The Corner?
In 2016 and 2017, only a very slight uptick in the use of Petroleum Liquids for electricity generation was observed, unlike previous years when the use of Petroleum Liquids jumped by up to 1 percent in either January or February compared to the typical levels for the rest of the year. The unusually cold weather in January 2018 resulted in significant up tick (1 percent) in the use of Petroleum Liquids similar to that seen in the years prior to 2016 but in February it returned to levels more consistent with previous years.
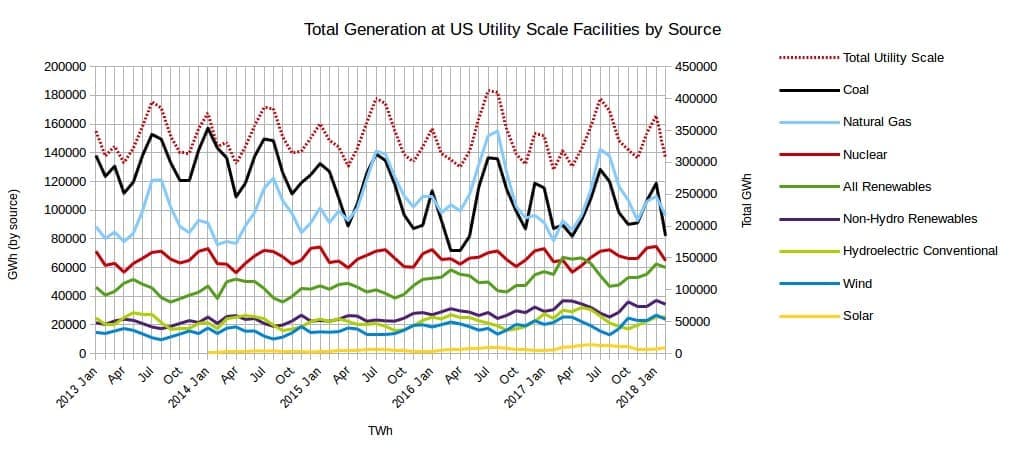
The graph below helps to illustrate how the changes in absolute production affect the percentage contribution from the various sources.
(Click to enlarge)
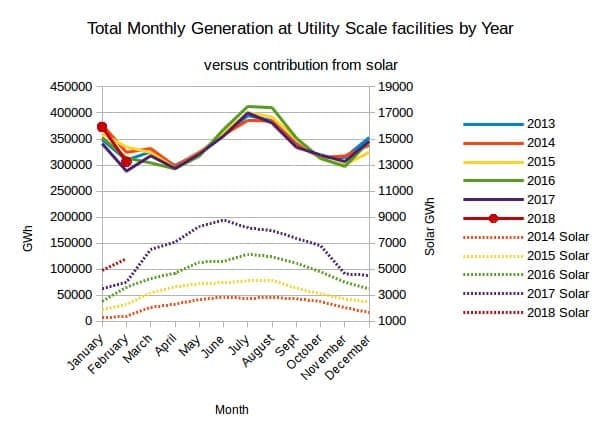
The chart below shows the total monthly generation at utility scale facilities by year versus the contribution from solar. The left-hand scale is for the total generation, while the right hand scale is for solar output and has been deliberately set to exaggerate the solar output as a means of assessing it’s potential to make a meaningful contribution to the midsummer peak. In February 2018 the output from solar was 5812 Gwh, 4.2 times what it was four years ago in February2014. If the summer output continues to follow recent trends, close to 12,000 GWh should be generated in a single month sometime this coming summer.
(Click to enlarge)
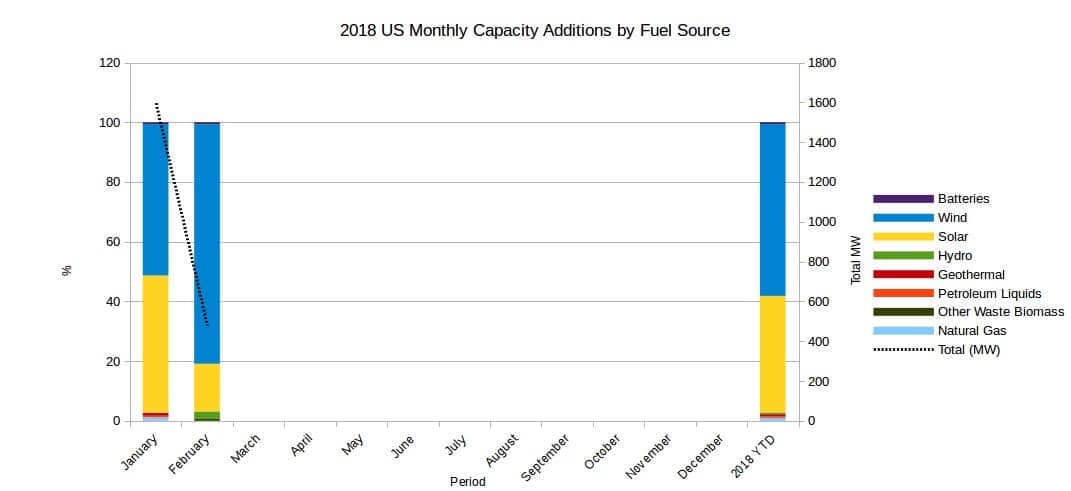
The graph below shows the monthly capacity additions for 2018. Last month I changed the format of the chart so as to reduce the amount of changes I have to make to the source table each month. By putting the year to date figures at the bottom of the table, when I fill in the data for each month, the Year to Date figures will be updated without any input from me.
Related: Oil Prices Up As Iran Deal Hangs In The Balance
In February 2.5 percent of capacity additions were Conventional Hydroelectric. Solar added 16 percent and Wind contributed 80.19 percent of new capacity for a joint contribution of 96.19 percent. Batteries had a relatively minor capacity addition of 0.69 percent and capacity additions fueled by Other Waste Biomass amounted to 0.62 percent. In February 2018 the total added capacity reported was 480.1 MW, roughly 872 MW less than February 2017.
(Click to enlarge)
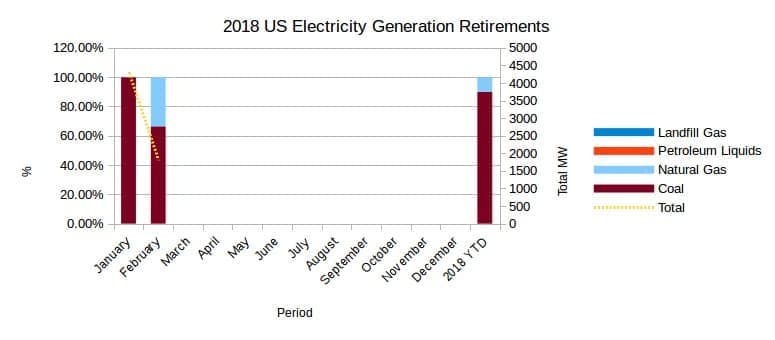
The chart below shows the monthly capacity retirements so far for 2018 with the same format changes as the chart above for the same reason. In February, 66.45 percent of the retirements were Coal fired plants (1208 MW) and 33.55 percent were fueled by Natural Gas (610 MW).
(Click to enlarge)
2018 has continued to go adversely for fossil fuel interests in the electricity generating sector, especially for coal with 90 percent of retirements for the year to date. Other fossil fuel interests have nothing to celebrate with only 1.3 percent of new capacity added year to date using fossil fuels.
By Peak Oil Barrel
More Top Reads From Oilprice.com:
- China To Double Shale Gas Output
- Oil Markets: The Calm Before The Storm
- Higher Prices Set To Send U.S. Oil Stocks Soaring


