


After a short-lived, half-hearted rally, oil prices are down again with a vengeance, retracing levels last seen before the assassination of General Soleimani by the American government.
WTI prices surged towards $70 per barrel after the killing; the latest trajectory has taken prices below $59 per barrel even as efforts at de-escalation continue; the US and China close in on a Phase One Trade Deal, while another weak job report revived concerns about an economic slowdown.
In a nutshell, geopolitical issues have taken a backseat while supply/demand worries rule the roost again.
Volatility in the crude oil market is nothing new, really, but can become exacerbated when there are so many major catalysts pulling in different directions. However, with some major overhangs now seemingly out of the way, traders will be focusing on one metric to gauge oil demand: crack spreads.
CL:NMX New York Mercantile Exchange (NYMEX) › Energy › CRUDE OIL (CL)
Source: Nasdaq
There’s A Demand Indicator Hidden In Here
Crack spread refers to the overall price differential between the price of a barrel of crude oil and the price of petroleum products refined from it.
The “crack” is an industry term that refers to the process of breaking apart crude oil into different components including gaseous products like propane, heating fuel, gasoline, light distillates like jet fuel, heavy distillates like grease and intermediate distillates like diesel fuel.
The price of crude oil does not always perfectly align with the various prices of the products refined from it. Global supplies, weather fluctuations and many other factors, especially the supply and demand for various distillates, result in pricing changes that directly impact profit margins for the refiner. Related: China’s Oil Demand Growth Could Halve This Year
Crack spreads are essentially the economics of refining a barrel of crude oil into its constituent products and can be used as a proxy to gauge demand for various distillates.
When crack spreads are moving higher, it tends to signal growing demand for oil products or falling crude prices, meaning higher profit margins for refiners. Consequently, narrowing spreads tend to signal weakening demand in refined products or rising crude prices resulting in worsening margins for refiners.
Gasoline crack spreads tend to exhibit strong seasonality as they frequently decline during the winter months and move higher with increasing demand as spring and summer seasons approach. The current price action suggests softening demand mainly due to a seasonal weakness in gasoline.
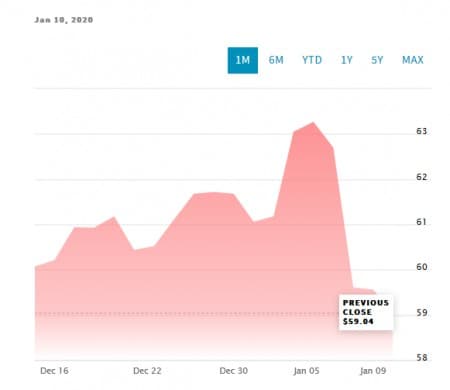
In the weekly chart below, the gasoline crack spread declines from a processing margin $15.64 per barrel around mid-October 2019 to just $10.51 on January 10. This sharp fall is a sign of seasonal weakness in gasoline demand.
The prospects for lower crack spreads in the early part of 2020 are high considering the sharp fall recorded during last year’s corresponding period.

Source: CME Group
The weekly chart for distillate crack spreads confirms what the gasoline spread chart is telling us: a general weakening in oil products demand. Although distillate cracks tend to be less sensitive to seasonality, they, too, have recorded a considerable decline from $28.42 per barrel in mid-October to $22.26 on January 9.
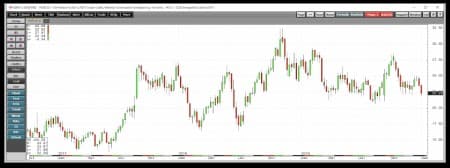
Source: Seeking Alpha
Checking crude, gasoline and distillate inventory trends further paints a picture of lackluster demand. According to data by the American Petroleum Institute (API), American crude oil inventories have declined each week over the last three consecutive week to a collective tune of 21.65 million barrels; in contrast, gasoline inventories have climbed by 6.49 million barrels over the timeframe while distillate stockpiles are up by 10.88 million barrels.
EIA reports are even more bearish.
Trading the Crack Spread
Still, it’s entirely possible to profit from this fickle market.
To mitigate volatility and pricing risks in the oil markets, refiners use futures to hedge crack spreads and lock-in profits. Futures and options traders can also use crack spread to speculate on potential price changes and also to hedge other investments.
You can either buy or sell the crack spread depending on the direction that you expect the market to take. Related: Mexico’s Oil Future Is In Jeopardy
Buying it means you expect the crack spread to strengthen: In other words, you expect refining margins are improving either due to crude oil prices falling and/or demand for the refined products improving.
On the other hand, selling it means you expect the crack spread to weaken, or you think refining margins are deteriorating either due to crude oil prices climbing and/or demand for the refined products worsening.
ADVERTISEMENT
There are several crack spread plays to choose from, with the 1:1 crack spread being the most common. More complex hedging strategies are the 3:2:1 crack spreads and sometimes 5:3:2 crack spreads.
You can also gain direct exposure by trading shares of refiners like Valero Energy Corp. (NYSE:VLO).
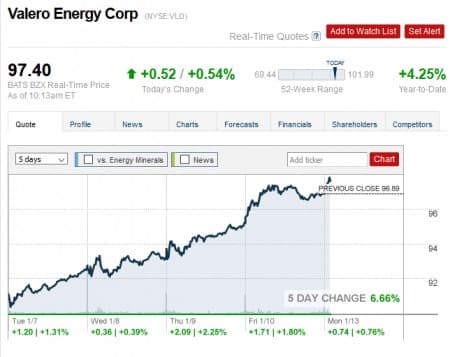
Source: CNN Money
With the ICE Heating Oil/Brent Crack Spread, you can trade the spread between the ICE Heating Oil Futures and ICE Brent Futures which gives to two separate positions: a long position in ICE Heating Oil Futures and a short position in ICE Brent Futures.
The ICE March ULSD crack spread against Brent was $19.20/b on December 26th. By January 8th, it was already down to $16.96/b, according to S&P Platts.
Right now, the oil market is looking fundamentally weak, as indicated by its lackluster response to major geopolitical events. If you’re not going to trade the crack, you can at least use it as an indicator of what’s to come. Crack spreads are down, and that tells us something about refining margins because risking crack spreads increase earnings for refiners.
Either way, beware the crack.
By Alex Kimani for Oilprice.com
More Top Reads From Oilprice.com:
- The Iran Crisis Is Far From Over
- Are Oil Prices Still Too High?
- Why Gas Prices Aren’t Soaring On Iranian Conflict


